Custom Health Check
Custom health checks let you use a custom tool or REST API endpoint to monitor the health of your service(s).
To add a custom health check, you'll need the REST API endpoint of your custom tool, and any REST headers required to access the endpoint (e.g. for authentication).
- Open the Health Checks page in the Gremlin web app and click + Health Check.
- If you want to reuse an existing custom tool, select the name of the tool from the drop-down list and continue to step 3. Otherwise, select Other and follow these instructions:
- Enter a Nickname for the health check.
- If your observability tool is in multiple different regions or sites, select Yes under Does this observability tool have multiple regions. This lets you specify which region to use when selecting this URL.
- If the endpoint is behind a private network, select Yes under Is this observability tool behind a firewall or on-prem.
- Enter the Authentication Endpoint URL. This is the URL that you use to authenticate with your tool.
- Add any required REST API request headers by clicking + Add Header in the Authentication section. Examples might include:
- Click Authenticate Observability Tool to send a test request to the endpoint. If the request is successful, Gremlin displays the response received. Double-check the contents to make sure this is the response you expected.
- Click Save Authentication, then click Next.
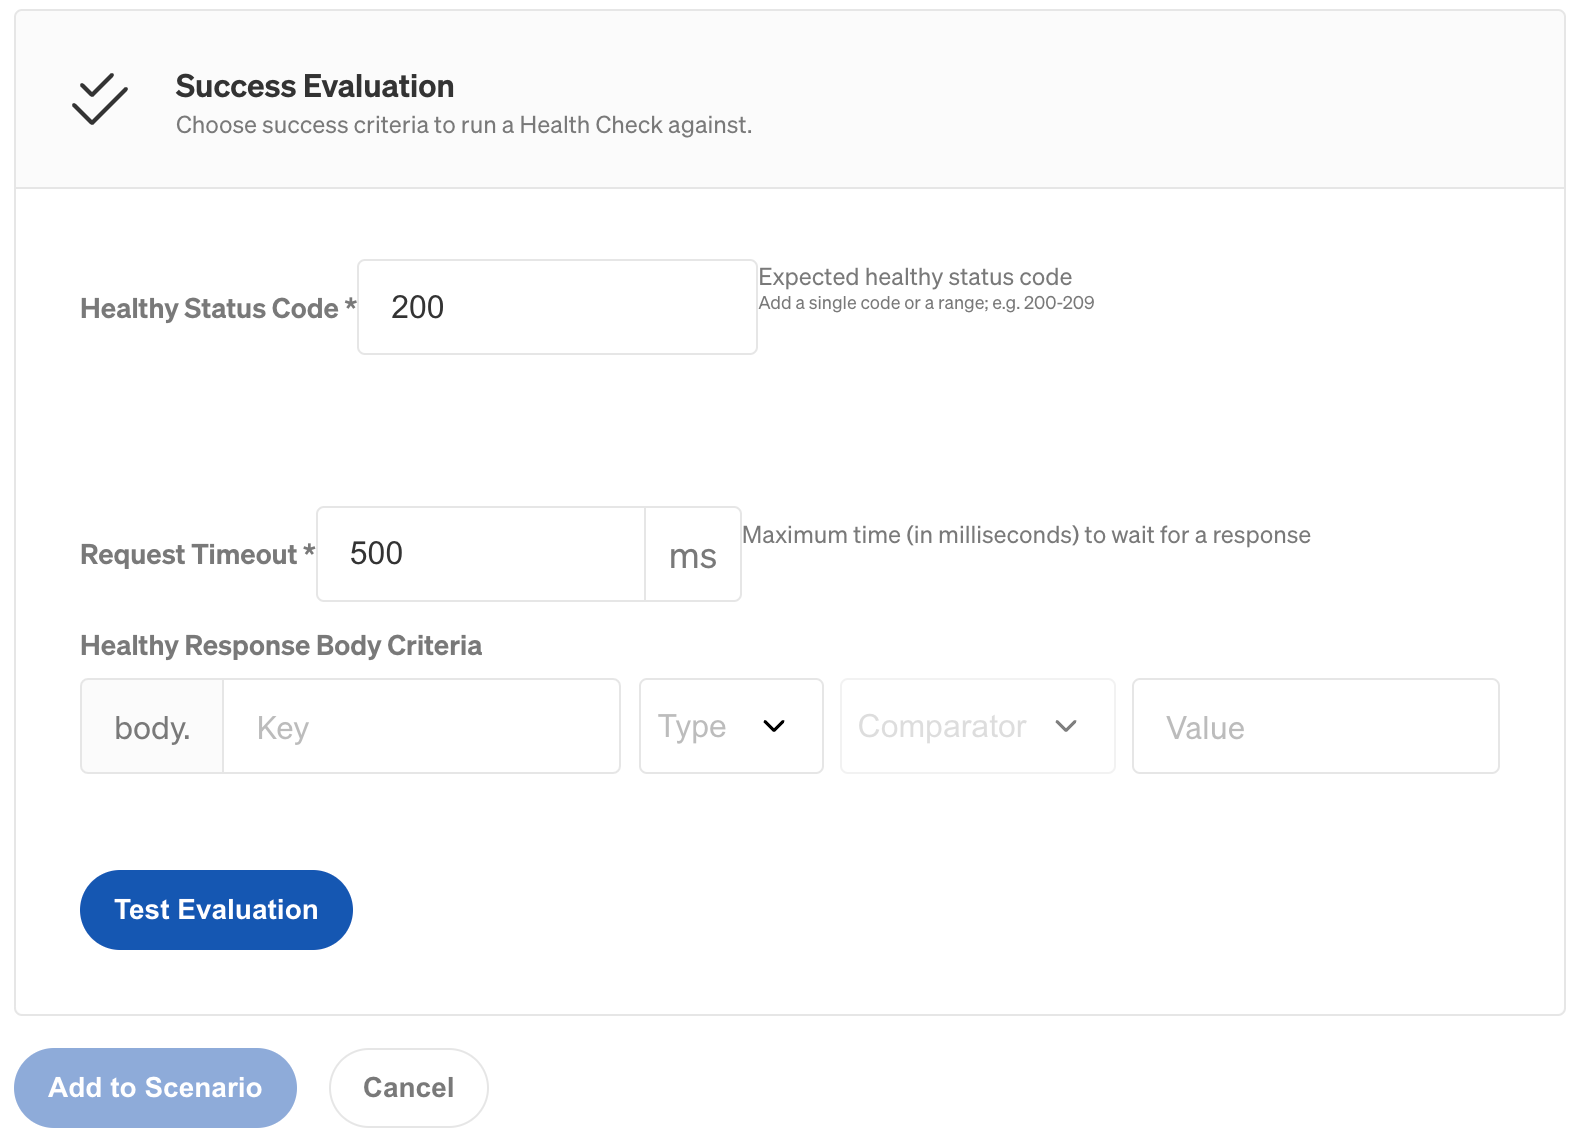
- Adjust the Success Evaluation criteria to your needs. By default, Gremlin considers the check to be successful if it returns an HTTP 200 status code within 1000 milliseconds (1 second). You can change these values to fit your requirements or keep the defaults.
- If your response contains a JSON object, the Healthy Response Body Criteria form will appear. You can enter the JSON path of a specific field and compare its value to an expected value using this form. Read adding success evaluation criteria below for more information.

- If your response contains a JSON object, the Healthy Response Body Criteria form will appear. You can enter the JSON path of a specific field and compare its value to an expected value using this form. Read adding success evaluation criteria below for more information.
- Click Test Evaluation to send another test request to your endpoint. This is to ensure the response meets your criteria.

- Click Save to save the new health check.
This custom integration will be available for all Gremlin team members to use for adding additional custom Health Checks. Team members will be able to select it in the Integrations drop-down when adding a Health Check to a Service.
Adding success evaluation criteria
Custom Health Checks require an additional step: setting success criteria. This tells Gremlin how to interpret the response received from your endpoint to determine whether your systems are unhealthy or unhealthy. The following sections explain each of the different fields and how they impact success evaluation.
Healthy status code
Add the status code the response should include if the service is healthy. If the status code responds outside of this code or range of codes then the Scenario will automatically halt. See the list of HTTP Status Codes for more guidance. Besides a single HTTP Status Code, you can also enter in a range such as 200-204.
Request timeout
For the Request Timeout, add the maximum time in milliseconds to wait for a response before halting the Scenario. For example, you might add a Health Check before starting a latency experiment to validate your service is responding within your Service Level Indicator (SLI) and Service Level Objectives (SLO) requirements. This would ensure that a Scenario halts prior to introducing even more latency on your service.
Healthy response body criteria
Add the key that you expect from the response body, and then add a comparator to ensure the value associated with that key is accurate. If the value doesn’t pass the comparator you add, the Scenario will halt. This field is especially important for evaluating the responses from 3rd party monitoring software. At this time, we support JSON response bodies. This was implemented using the Jayway JsonPath library. Please refer to their docs for options for evaluating response body criteria as well as the basic Operators and Functions tables below.
Operators
| Operator | Description |
|---|---|
$ | The root element to query. This starts all path expressions. |
@ | The current node being processed by a filter predicate. |
* | Wildcard. Available anywhere a name or numeric are required. |
.. | Deep scan. Available anywhere a name is required. |
.<name> | Dot-notated child |
['<name>' (, '<name>')] | Bracket-notated child or children |
[<number> (, <number>)] | Array index or indexes |
[start:end] | Array slice operator |
[?(<expression>)] | Filter expression. Expression must evaluate to a boolean value. |
Tables are from the Jayway JSONpath library
Functions
Functions can be invoked at the tail end of a path - the input to a function is the output of the path expression. The function output is dictated by the function itself.
| Function | Description | Output |
|---|---|---|
min() | Provides the min value of an array of numbers | Double |
max() | Provides the max value of an array of numbers | Double |
avg() | Provides the average value of an array of numbers | Double |
stddev() | Provides the standard deviation value of an array of numbers | Double |
length() | Provides the length of an array | Integer |
sum() | Provides the sum value of an array of numbers | Double |
Tables are from the Jayway JSONpath library

Once you’ve added the above fields, use the “Test Evaluation” button to ensure that you’ve successfully set up the Health Check criteria. A successful response will confirm your success criteria and enable the “Add to Scenario” button. If your endpoint URL responds with failed criteria you will still be able to add the Health Check to the scenario since your service could be unhealthy at that point in time.
