What I Learned Running the Chaos Lab: Kafka Breaks

At Chaos Conf, we helped dozens of folks plan GameDays around the critical dependencies of their apps. Briefly, a GameDay involves making a hypothesis about how you expect your system to behave in the face of some form of stress, and then designing a targeted experiment to test your hypothesis. It’s a useful way to gain confidence that you truly know how your system will handle real world failure.
We worked with companies across a ton of industries, from media, finance, advertising, healthcare, and education, and so we saw a ton of different architectures, but one of the more common systems we “broke” was Kafka.
As the world transitions to microservices and distributed computing, the message pipeline is quickly becoming a central service in many (not all) environments, and so it’s worth a post to think through how it can break so we can engineer Kafka resilience
The first step is to understand what level you have access to test your Kafka infrastructure. Some of you have direct access and/or manage the message queue infrastructure. Some of you are solely on the application side, maintaining a producer or consumer. Some of you folks even manage both. With that in mind, I’ve created some examples around both the application side and the message queue cluster side.
Once you have the prerequisites in place, it’s time to run some experiments.
As we walk through these, keep in mind that due to the vast number of Kafka configuration permutations, a test between two slightly different configurations may have substantially different outcomes, which is why it’s important to test for yourself how your system will behave, rather than assume. You’ll notice that I do not define any results because my results will not apply to your clusters or applications. Do your homework here, extrapolate second and third order tests from each example, run the tests and record the outcomes, and from that output derive your own action items and takeaways. You will be surprised, trust me.
Blast Radius, Experiment Timing, and Precautions
A quick word on blast radius, for those unfamiliar with Chaos Engineering. This is the phrase we use to denote the scope of intention. We want to be as precise with this as possible, to break only what we intend to break and control the variables as much as possible. When first starting out it is critical to keep the blast radius as small as possible, and to abort experiments as soon as something unexpected is affected.
As we think about how long to run our experiments for, the monitoring cycle should be given consideration. A typical monitoring system gathers statistics every five minutes, and usually want to see the impact of our testing register in that system. For that reason, we suggest ten minutes as a default metric for experiment length. This will allow you to a chance to see observable change in your monitoring logs and graphs.
One more note and caution before proceeding. We don’t encourage you to test on overly brittle systems; that is when you know something is a single point of failure, or there is a clearly defined issue that needs to be resolved first. Instead we encourage you to fix those issues and create experiments around verifying that the issue has indeed been resolved.
Using Gremlin Scenarios
Since 2017, Gremlin has offered a platform to run Chaos Engineering experiments, enabling our customers to increase the reliability of their applications. Gremlin provides a variety of different failure modes across state, resource, network, and application to test your reliability. However until now, while running a single Chaos Engineering attack has been simple, we’ve received many customer requests to simplify planning and tracking an experiment to simulate a real-world outage.
Recommended Scenarios guide you through Chaos Engineering experiments to be sure that your application is reliable despite resource constraints, unreliable networks, unavailable dependencies, and more, preventing these types of outages from affecting your business and your customers.
The practice of Chaos Engineering is all about injecting failure, starting with a small blast radius, a low number of hosts, and with limited magnitude, such as a minimal CPU load. Scenarios allow you to create many attacks and link them together, growing both the blast radius and magnitude over time. We recommend using Scenarios when testing your Kafka clusters for reliability.
Testing the message queue producers and consumers
For those of you who don’t have direct access to your Kafka cluster, or whichever message queue your organization uses, let’s start with testing the parts of your application that are producers and consumers. Ideally these services should be fairly well identified and isolated, so that you can minimize the blast radius of the experiments you will be running.
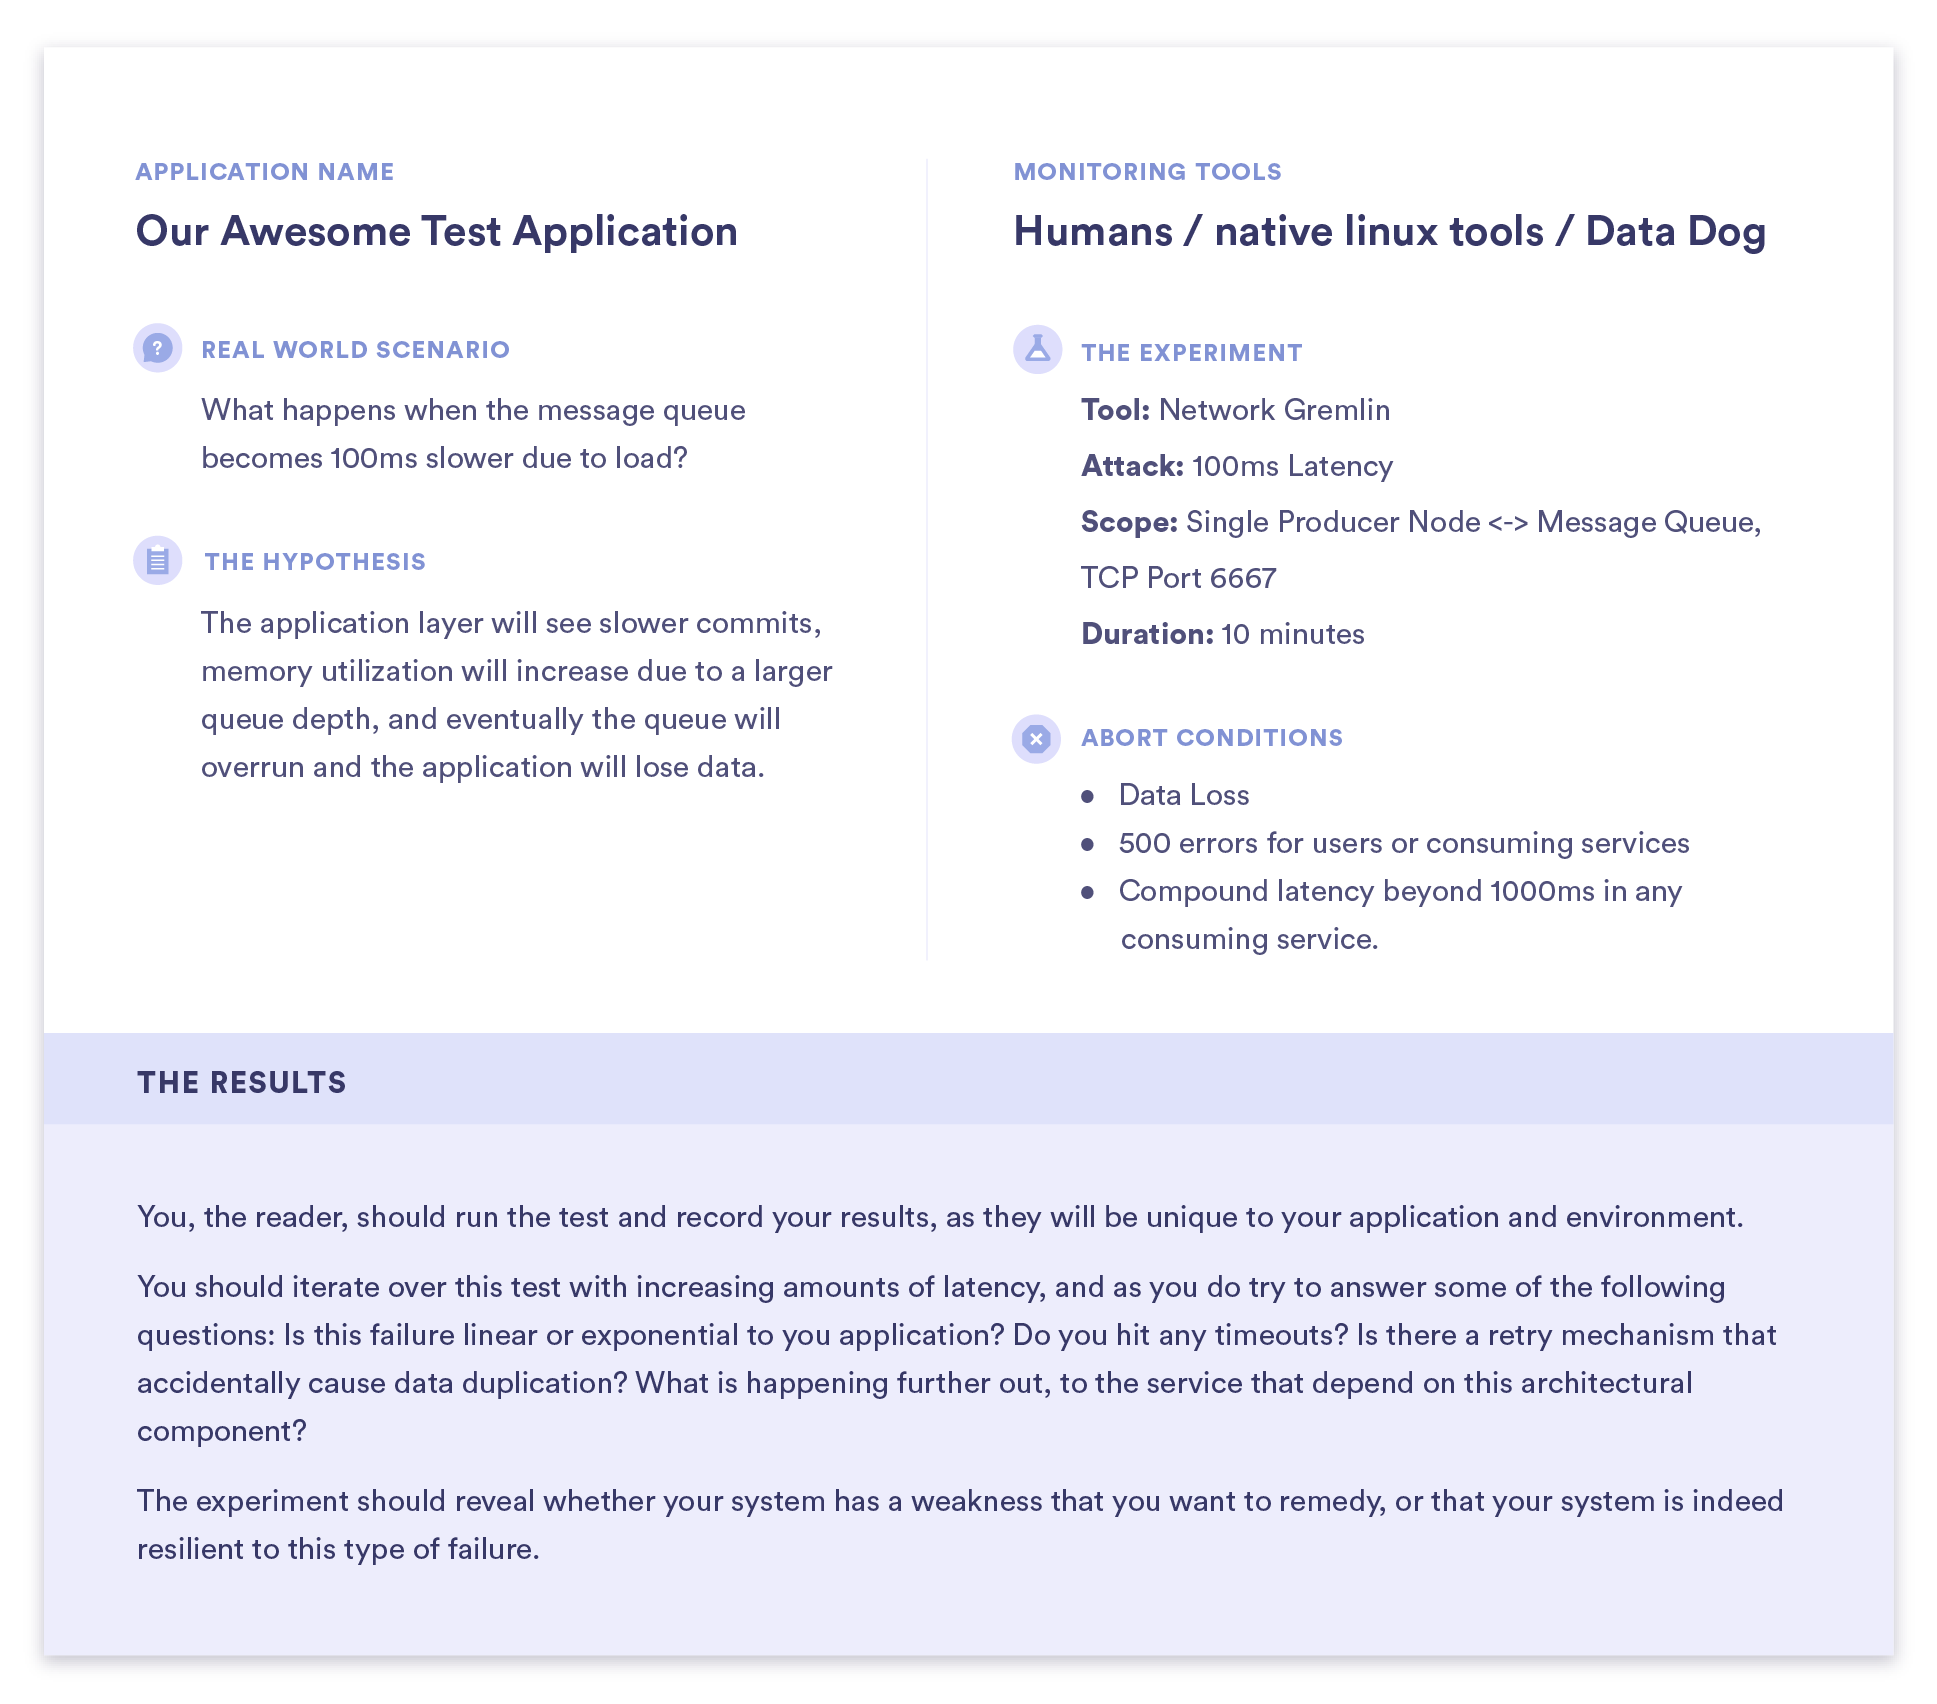
Experiment 1

Application name: Our Awesome test application
Real World Scenario / Question: what happens when the message queue becomes 100ms slower due to load
The Hypothesis: The application layer will see slower commits, memory utilization will increase due to a larger queue depth, and eventually the queue will overrun and the application will lose data
Monitoring tools: Humans / native linux tools / Datadog
The Experiment: Network Gremlin; Latency 100ms; Scope: Single Producer Node <-> Message Queue, TCP Port 6667; Duration: 10 minutes
Abort Conditions: Data Loss; 500 errors for users or consuming services; Compound latency beyond 1000ms in any consuming service.
The Results: You, the reader, should run the test and record your results, as they will be unique to your application and environment
You should iterate over this test with increasing amounts of latency, and as you do try to answer some of the following questions: Is this failure linear or exponential to you application? Do you hit any timeouts? Is there a retry mechanism that accidentally cause data duplication? What is happening further out, to the service that depend on this architectural component?
The experiment should reveal whether your system has a weakness that you want to remedy, or that your system is indeed resilient to this type of failure.
Experiment 2

Application name: Our Awesome test application
Real World Scenario / Question: What happens when we experience packet loss between our application and the message queue?
The Hypothesis: much like the the latency test, we expect queues to fill, potentially losing some data due to failure to complete a transaction
Monitoring Tools: Humans / native Linux tools / Datadog
The Experiment: Network Gremlin; 10% packet loss; Scope: Single Producer Node <-> Message Queue, TCP Port 6667; Duration: 10 minutes
Abort conditions: Data loss; Excessive 500 errors for users or consuming services; Compound latency beyond 1000ms in any consuming service.
The Results: You, the reader, should run the test and record your results, as they will be unique to your application and environment
Again, iteration over this test can be very beneficial. How many times have you encountered a bad switch in the network that’s hitting upwards of 50% packet loss? I have, more than I care to admit. At some level of latency things become completely unusable, which leads us to our next experiment...
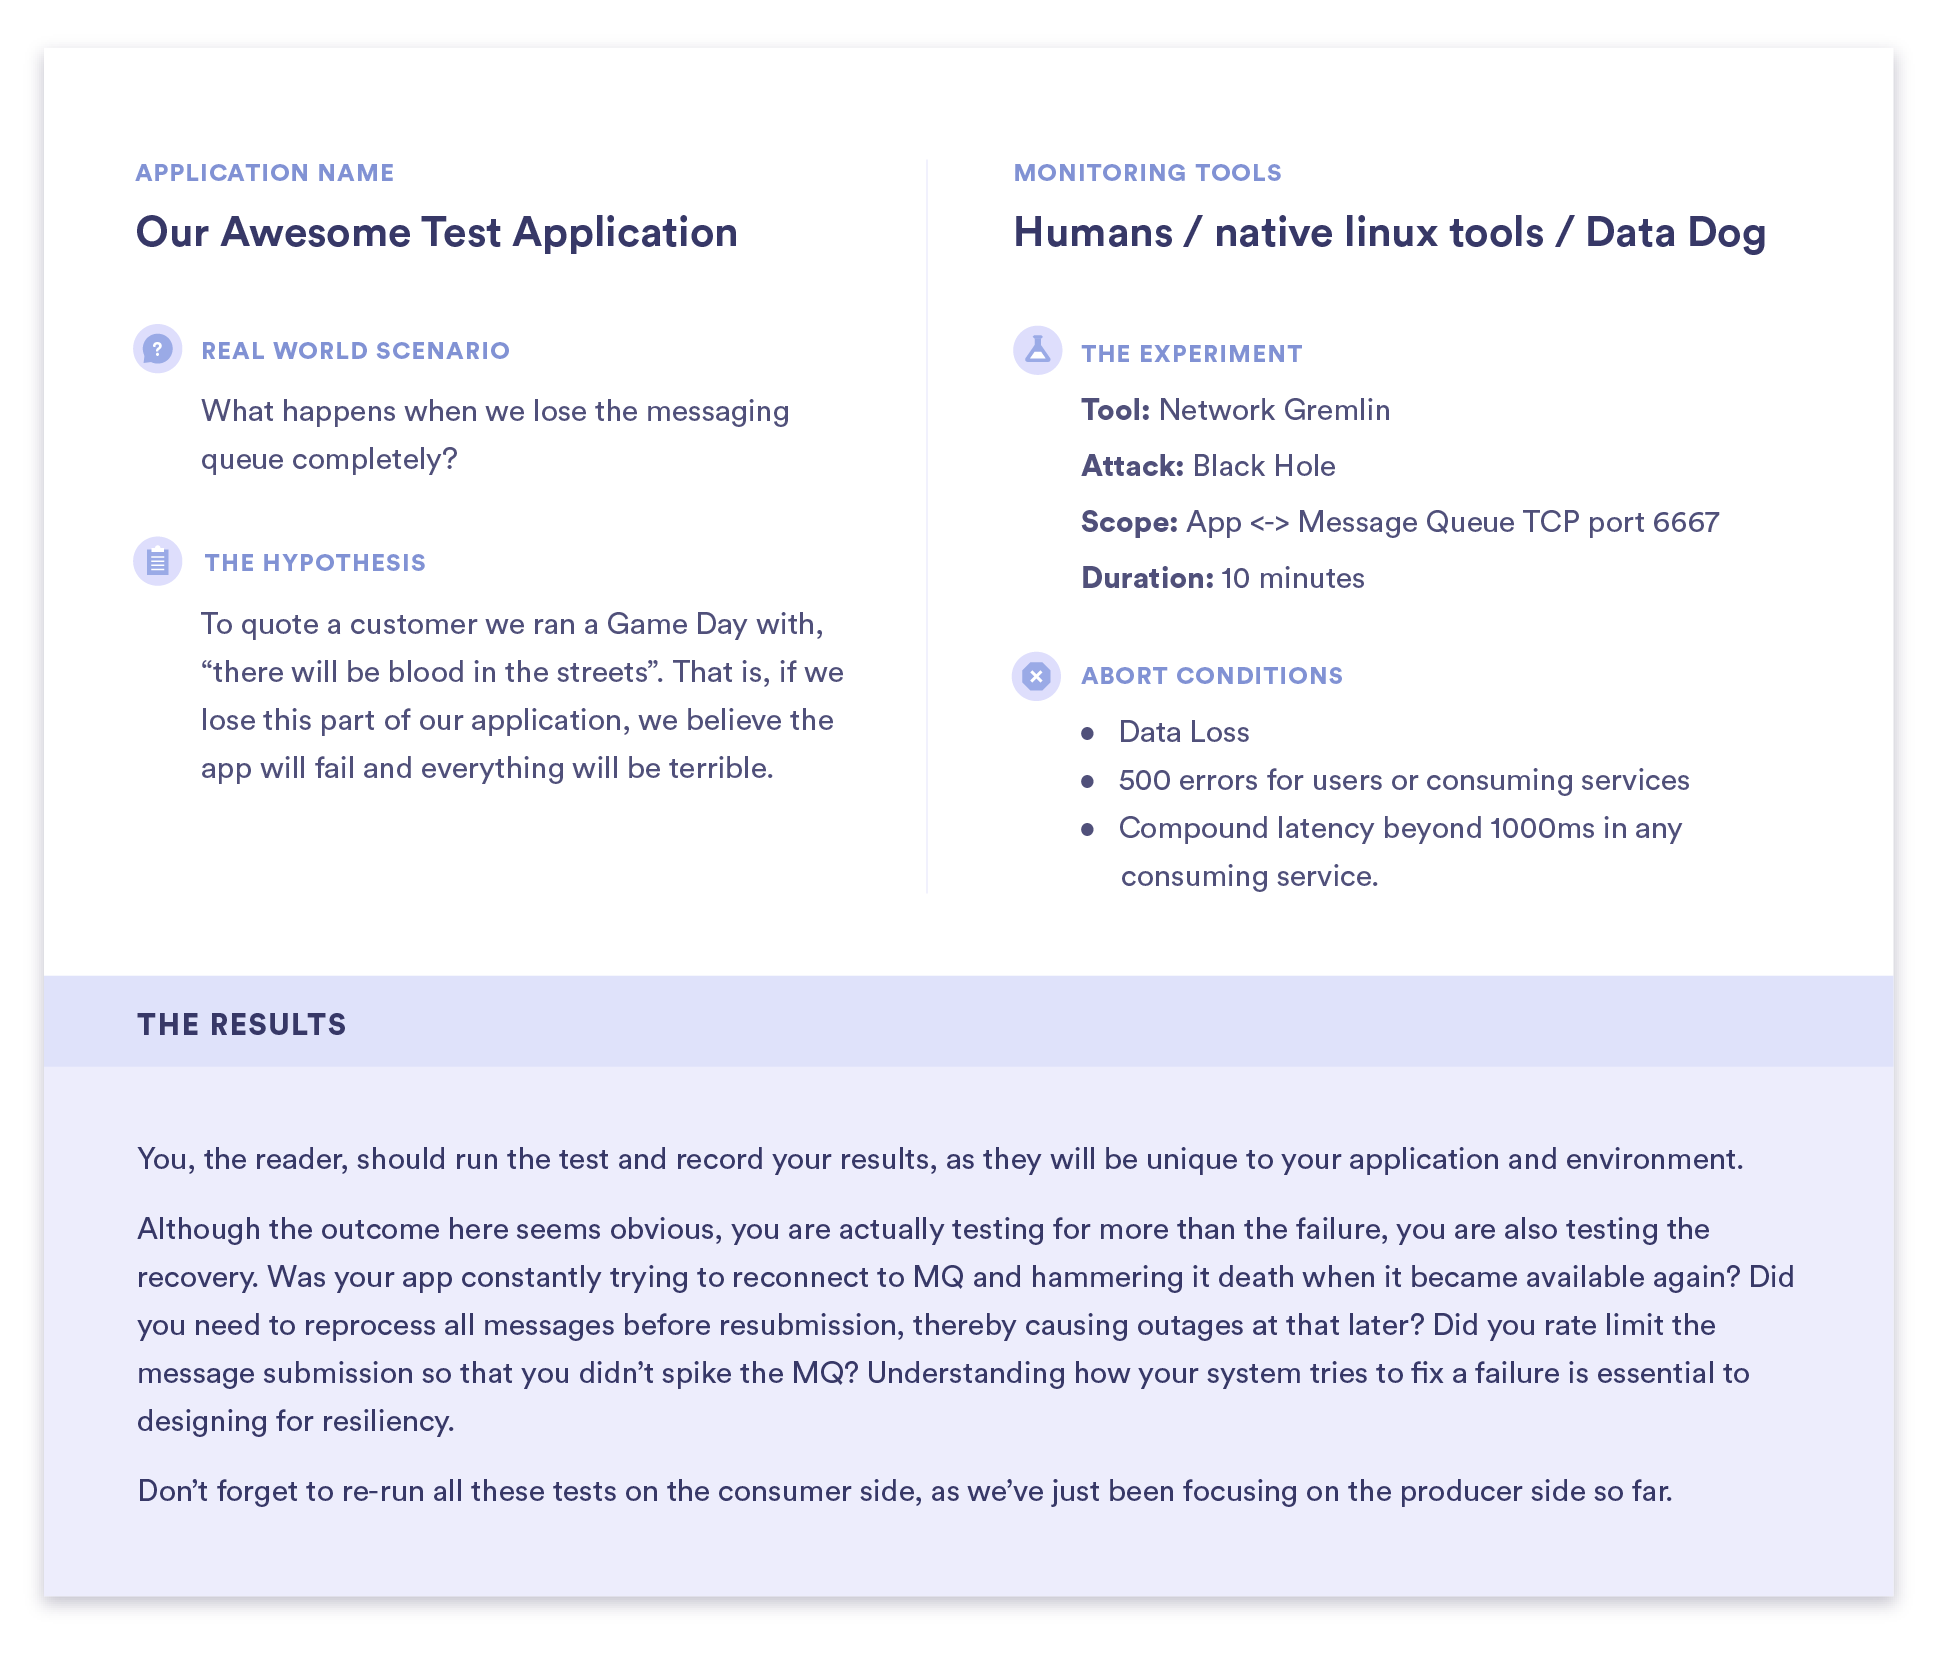
Experiment 3

Application name: Our Awesome test application
Real World Scenario / Question: What happens when we lose the messaging queue completely?
The hypothesis: To quote a customer we ran a Game Day with, “there will be blood in the streets”. That is, if we lose this part of our application, we believe the app will fail and everything will be terrible.
Monitoring tools: Humans / native linux tools / Datadog
The Experiment: Network Gremlin; Black Hole; Scope: App <-> Message Queue TCP port 6667; Duration 10 minutes
Abort conditions: Data Loss; Excessive 500 errors for users or consuming services; Compound latency beyond 1000ms in any consuming service.
The Results: You, the reader, should run the test and record your results, as they will be unique to your application and environment
Although the outcome here seems obvious, you are actually testing for more than the failure, you are also testing the recovery. Was your app constantly trying to reconnect to MQ and hammering it death when it became available again? Did you need to reprocess all messages before resubmission, thereby causing outages at that later? Did you rate limit the message submission so that you didn’t spike the MQ? Understanding how your system tries to fix a failure is essential to designing for resiliency.
Don’t forget to re-run all these tests on the consumer side, as we’ve just been focusing on the producer side so far.
Testing the message queue cluster
Now that we’ve created some basic tests for the application side, let’s talk about what to test when you own the whole Kafka cluster. Broker nodes will never disconnect from ZooKeeper, and that ZooKeeper will never encounter failure or inconsistency, right?
Except… well, what happens when one ZooKeeper node has stopped synchronizing with NTP and it’s clock time is skewed from the other nodes? Oh, what about that time an election kicked off and didn’t resolve? Remember that time DNS affected your ability to communicate to the backend storage? Ok, maybe you’re not so good, let’s dig in.
Testing here is going to become highly dependent on your Kafka cluster configuration, and to date, I’ve never seen two Kafka clusters configured the same way. However, the first real world test is the loss of a broker node.
Experiment 4

Application Name: Kafka
Real World Scenario / Question: Will my Kafka cluster survive the loss of a single broker node? Two?
The Hypothesis: steady-state capacity should be calculated to suffer the loss of selected nodes, load should increase on remaining nodes, producers and consumers should see no impact
Monitoring Tools: Humans / native linux tools / Datadog
The Experiment: Network Gremlin; Black Hole; Scope: single Broker node, TCP Port 6667; Duration 10 minutes
Abort Conditions: Data loss; Excessive 500 errors for users or consuming services.
The Results: You, the reader, should run the test and record your results, as they will be unique to your application and environment
Experiment 5

Application name: Kafka
Real World Scenario / Question: what happens when one ZooKeeper node, maybe the leader node, has decided ntp is not worth syncing to.
The Hypothesis: We assume the other ZooKeeper nodes should be able to form a quorum and kibosh the misbehaving node, this will verify this assumption.
Monitoring Tools: Humans / native linux tools / Datadog
The Experiment: Resource Gremlin; Time Travel + 400 days; Scope: single ZooKeeper node; Duration 10 minutes
Abort Conditions: Data Loss; Excessive 500 errors for users or consuming services; Cluster fails to initiate election and remove misbehaving node.
The Results: You, the reader, should run the test and record your results, as they will be unique to your application and environment
Experiment 6

Application Name: Kafka
Real World Scenario / Question: What happens when my distributed storage fails?
The Hypothesis: I’m going to lose the entire cluster.
Monitoring tools: Humans / native linux tools / Datadog
The Experiment: Network Gremlin; Black Hole; Scope: ZooKeeper nodes <-> Storage Pool; Duration 10 minutes
Abort Conditions: Data loss; Excessive 500 errors for users or consuming services.
The Results: You, the reader, should run the test and record your results, as they will be unique to your application and environment
Since we know it will cause an outage, why are we running this experiment?
At any level of scale, the storage being used by your cluster will be distributed and complex. We know it will fail at some point, and while yes, we are testing something that is some level of brittle, it’s worthwhile to understand how the application around your message queue responds to this failure. Again, we want to build confidence that we understand how our system will respond to failure because this will help us architect for resilience as well as give us confidence during an outage.
In this case, are there some layers of caching happening that can catch this failure? Are your service owners doing some amount of error handling on their own and soft failing? Did Kafka only half break and now it’s giving bad data to my consumers? These are the things we’re trying to discover when we ask the question of “What happens when my storage fails?”
Conclusion
Go forth and create experiments that will help you learn about your systems, your infrastructure and applications. Create experiments that help you understand your organization, your response to real world events, and the chaos of ever growing complexity. Get creative with them, but keep the blast radius in mind; don’t go testing things you already know to be fragile. Fix them first and then test to ensure you’ve solved a problem, then think about automating that experiment to ensure it doesn’t regress.
Check out our comprehensive Chaos Engineering for Kafka guide to learn more about common Kafka failure modes and how to build resilience against them.
Related


Avoid downtime. Use Gremlin to turn failure into resilience.
Gremlin empowers you to proactively root out failure before it causes downtime. See how you can harness chaos to build resilient systems by requesting a demo of Gremlin.
Get started