
The first 4 chaos experiments to run on Apache Kafka
Apache Kafka is an open source distributed messaging platform that can deliver data at high throughput and with low latency. At scale, it can handle trillions of records per day while also providing fault tolerance, replication, and automatic disaster recovery.
While Kafka has many different use cases, the most common is as a message broker between applications. Kafka can receive, process, and redistribute messages from multiple upstream sources to multiple downstream consumers without requiring you to reconfigure your applications. This allows you to stream high volumes of data while keeping your applications loosely coupled, supporting use cases such as distributed computing, logging and monitoring, website activity tracking, and Internet of Things (IoT) device communication.
Since Kafka provides a critical pipeline between applications, reliability is paramount. We need to plan for and mitigate several possible failure modes, including:
- Message broker outages and other unhealthy cluster conditions
- Failures in Apache ZooKeeper, a critical dependency of Kafka
- Failures in our upstream and downstream applications
Instead of waiting for these failures to occur in staging or production, we can instead proactively test for them with Chaos Engineering so we can develop appropriate mitigation strategies. In this white paper, we’ll demonstrate how Chaos Engineering helps improve the reliability of Kafka deployments. We’ll do this by creating and running four chaos experiments using Gremlin, an enterprise SaaS Chaos Engineering platform. By reading this white paper, you’ll learn the different ways that Kafka clusters can fail, how to design chaos experiments to test these failure modes, and how to use your observations to improve reliability.
Throughout this white paper, we’ll be demonstrating chaos experiments on Confluent Platform, the enterprise event streaming platform from the original creators of Kafka. Confluent Platform builds on Kafka by adding enterprise features such as a web-based GUI, comprehensive security controls, and the ability to easily deploy multi-region clusters. However, the experiments shown in this white paper will work on any Kafka cluster.
Overview of the Apache Kafka architecture
In order to understand how Kafka benefits from Chaos Engineering, we should first look into Kafka’s architecture and design.
Kafka streams data using a publisher/subscriber (or pub/sub) messaging model. Upstream applications (called publishers, or producers in Kafka) generate messages that are sent to Kafka servers (called brokers). Downstream applications (called subscribers, or consumers in Kafka) can then fetch these messages from brokers. Messages can be organized into categories called topics, and a consumer can subscribe to one or more topics to consume its messages. By acting as a middleman between producers and consumers, Kafka lets us manage our upstream and downstream applications independently of one another.
Kafka subdivides each topic into partitions. Partitions can be mirrored across multiple brokers to provide replication. This also allows multiple consumers (more specifically, consumer groups) to process a topic simultaneously. To prevent multiple producers from writing to a single partition, each partition has one broker that acts as the leader, and zero or more brokers that act as followers. New messages are written to the leader while the followers replicate it. When a follower is fully replicated, it is called an in-sync replica (ISR).
This process is coordinated by Apache ZooKeeper, which manages metadata about the Kafka cluster, such as which partitions are assigned to which brokers. ZooKeeper is a required dependency of Kafka, but runs as a completely separate service on its own cluster. Improving the reliability of a Kafka cluster necessarily involves improving the reliability of its associated ZooKeeper cluster.
There are other components of Kafka and Confluent Platform, but these are the most important to consider when improving reliability. We’ll explain other components in more detail as we introduce them throughout the white paper.
Why do we need Chaos Engineering for Kafka?
Chaos Engineering is the practice of proactively testing systems for failure with the goal of making them more resilient. We do this by injecting small amounts of controlled harm into a system, observing the impact, and using our observations to address weaknesses and shortcomings. This lets us find and fix problems with our systems before they can cause issues for our users, while also teaching us more about how our systems behave under various conditions.
Distributed systems like Kafka are difficult to manage and operate efficiently due to countless configuration options, flexibility in how we can deploy producers and consumers, and many more factors. It’s not enough to keep our brokers and ZooKeeper nodes from failing, but we need to consider the more subtle and hard-to-predict problems that can occur in our applications, replicas, and other infrastructure components. These can impact our entire deployment in unexpected ways, and if they happen in production, may require extensive troubleshooting and firefighting.
Using Chaos Engineering, we can proactively test for these types of failures and address them before deploying to production, reducing the risk of outages and on-call incidents.
Chaos experiments to run on Kafka
In this section, we’ll walk through four different chaos experiments performed on a Confluent Platform deployment. A chaos experiment is an intentional, planned process through which we inject harm into a system to learn how it responds. Before running any experiments on your systems, you should fully think out and develop the experiments you want to run.
When creating an experiment:
Start with a hypothesis stating the question that you’re trying to answer, and what you think the result will be. For example, if your experiment is to test your ability to withstand a broker outage, your hypothesis might state that “if a broker node fails, messages are automatically routed to other brokers with no loss in data.”
Define your blast radius, which are the infrastructure components impacted by an experiment. Reducing the blast radius limits the potential harm that the experiment can do to your infrastructure, while also letting you focus your efforts on specific systems. We strongly recommend that you start with the smallest blast radius possible, then increase it as you become more comfortable with running chaos experiments.
- You should also define your magnitude, which is how large or impactful the attack is. For example, a low-magnitude experiment might be to add 20 ms of latency to network traffic between a producer and a broker. A high-magnitude experiment might be to add 500 ms of latency, since this will have a clear and significant impact on performance and throughput. As with the blast radius, start with a low magnitude and increase it gradually.
Monitor your infrastructure. Determine which metrics will help you reach a conclusion about your hypothesis, take measurements before testing to establish a baseline, and record those metrics throughout the course of the test so that you can watch for changes, both expected and unexpected. With Confluent Platform, we can use Control Center to visually observe cluster performance in real-time from a web browser.
Run the experiment. Gremlin lets you run experiments on your applications and infrastructure in a simple, safe, and secure way. We do this by running attacks, which provide various ways of injecting harm into our systems. We also want to define abort conditions, which are the conditions where we should stop the test to avoid unintentional damage.
- With Gremlin, we can define Health Checks as part of a Scenario. Health Checks let us validate the state of our service while running attacks. If our infrastructure becomes unhealthy and the Golden fails, it will automatically stop the experiment. Alternatively, we can use the built-in halt button to immediately stop the experiment ourselves.
Form a conclusion from your results. Does it confirm or reject your hypothesis? Use the results you collect to modify your infrastructure, then design new experiments around these improvements.
Repeating this process over time will help us make our Kafka deployment more resilient. The experiments presented in this white paper are by no means exhaustive, but should act more as a starting point for when you experiment on your own systems. Remember that although we’re running these experiments on Confluent Platform, they can be performed on any Kafka cluster.
Note that we are using Confluent Platform 5.5.0, which is built on Kafka 2.5.0. Screenshots and configuration details may differ based on your version.
Experiment 1: Impact of broker load on processing latency
Resource utilization can have a notable impact on message throughput. If our brokers are experiencing high CPU, memory, or disk I/O utilization, our ability to process messages will be limited. Since Kafka is only as efficient as its slowest component, latency can have a cascading effect across the entire pipeline and cause harmful conditions such as producer backups and replication delays. Heavy load can also affect cluster operations such as broker health checks, partition reassignments, and leader elections, putting the entire cluster in an unhealthy state.
Two of the most important metrics to consider when optimizing Kafka are network latency and disk I/O. Brokers constantly read and write data to and from local storage, and bandwidth usage can become a limiting factor as message rate and cluster size increase. When sizing a cluster, we should determine at which point resource utilization has a detrimental impact on performance and stability.
To determine this, we’ll perform a chaos experiment where we gradually increase disk I/O utilization across our brokers and observe its effects on throughput. While running this experiment, we’ll send a continuous stream of data using the Kafka Music demo application. This application sends messages to multiple topics spread across all three of our brokers, and uses Kafka Streams to aggregate and process messages.
Using an IO Gremlin to generate broker load
For this experiment, we’ll use an IO Gremlin to generate a large number of disk I/O requests across our broker nodes. We’ll create a Scenario and gradually increase the magnitude of the attack over four stages. Each attack will run for three minutes with a one minute break in between so that we can easily associate changes in I/O utilization with changes in throughput.
In addition, we’ll create a Status Check that uses the Kafka Monitoring API to check the health of our brokers between each stage. A status check is an automated HTTP request that Gremlin sends to an endpoint of our choice, which in this case is our cluster’s REST API server. We’ll use the topic endpoint to retrieve the status of our brokers and parse the JSON response to determine if they’re currently in-sync. If any of our brokers fall out-of-sync, we’ll immediately halt the experiment and mark it as a failure. While the Scenario is running, we’ll also use Confluent Control Center to monitor throughput and latency.

Hypothesis
Increasing disk I/O will cause a corresponding drop in throughput.
Conclusion
Even after increasing disk I/O to over 150 MB/s, the attack had no discernable impact on throughput or latency. Both metrics remained stable, none of our brokers became out-of-sync or under-replicated, and no messages were lost or corrupted.

This leaves us with plenty of overhead for now, but as we scale up our applications, our throughput requirements will likely increase. We should keep a close eye on disk I/O utilization to make sure we have enough room to scale. If we start to notice disk I/O increasing and throughput decreasing, we should consider:
- Using faster storage devices, such as higher RPM magnetic disks or solid state storage
- Using more efficient compression algorithms, such as Snappy or LZ4
Experiment 2: Risk of data loss due to dropped messages
To ensure messages are delivered successfully, producers and brokers use an acknowledgement mechanism. When a broker commits a message to its local log, it responds to the producer with an acknowledgement, indicating that the message was successfully received and that the producer can send the next message. This reduces the risk of lost messages between the producer and broker, but it does not prevent lost messages between brokers.
For example, imagine we have a leader broker that just received a message from a producer and sent an acknowledgement. Each of the broker’s followers should now fetch the message and commit it to their own local logs. However, the broker unexpectedly fails before any of its followers can fetch the latest message. None of the followers are aware that a message was sent, but the producer has already received the acknowledgement, so it has moved on to the next message. Unless we can recover the failed broker or find another way to resend the message, it’s effectively lost.
How can we determine the risk of this happening on our own clusters? With Chaos Engineering, we can simulate a failure of our leading broker and monitor our message stream to determine the potential for data loss.
Using a blackhole Gremlin to simulate a leader broker outage
For this experiment, we’ll use a blackhole Gremlin to drop all network traffic to and from our leader broker. This experiment relies heavily on timing, as we want to cause a broker failure after the broker receives the message, but before its followers can replicate the message. There are two ways we can do this:
- Send a continuous stream of messages at a lower interval than the follower fetch interval (replica.fetch.wait.max.ms), initiate the experiment, and look for gaps in our consumer output.
- Use the Gremlin API to trigger a chaos experiment from our producer application immediately after sending the message.
For this experiment, we’ll use the first option. Our application produces a new message every 100 ms. We’ll record the output of our stream as a JSON list and analyze it to look for any gaps or inconsistent timings. We’ll run the attack for 30 seconds, which will generate 300 messages (one message every 100 ms).
Hypothesis
We’ll lose a few messages due to the leader failing, but Kafka will quickly elect a new leader and successfully replicate messages again.
Results
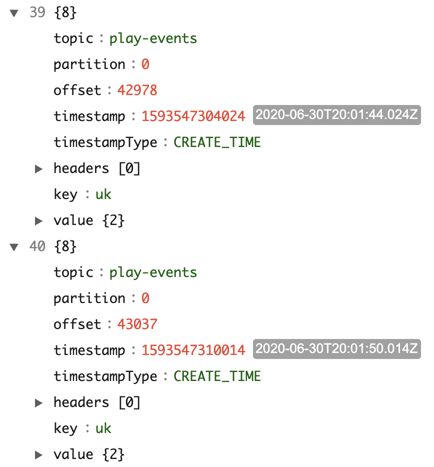
Despite the sudden leader failure, the message list shows all messages going through successfully. Our pipeline generated 336 events in total due to extra messages being recorded before and after the experiment, with each message having a timestamp roughly 100 ms after the previous event. The messages don’t appear in chronological order, but this is fine as Kafka doesn’t guarantee ordering of messages between partitions. Here is an example of our output:
If we wanted to guarantee that every message is saved, we can set acks=all on our producer configuration. This tells the producer not to send a new message until the message has been replicated to the leader broker and all of its followers. This is the safest option, but it limits throughput to the speed of the slowest broker and can therefore have a significant impact on performance and latency.
Experiment 3: Avoiding a split brain cluster
Kafka, ZooKeeper, and similar distributed systems are susceptible to a problem known as “split brain.” In a split brain, two nodes within the same cluster lose synchronization and diverge, resulting in two separate and potentially incompatible views of the cluster. This can lead to data inconsistency, data corruption, and even the formation of a second cluster.
How does this happen? In Kafka, a single broker node is assigned the role of controller. Controllers are responsible for detecting changes to cluster state, such as failed brokers, leader elections, and partition assignments. Each cluster has one and only one controller in order to maintain a single consistent view of the cluster. While this makes controllers a single point of failure, Kafka has a process for handling this type of failure.
All brokers periodically check in with ZooKeeper to identify themselves as healthy. If a broker does not respond for longer than the zookeeper.session.timeout.ms setting (18,000 ms by default), ZooKeeper will mark the broker as unhealthy. If the broker is a controller, this triggers a controller election and an ISR becomes the new controller. This new controller is assigned a number called a controller epoch, which tracks the latest controller election. If the failed controller comes back online, it will compare its own controller epoch to the epoch stored in ZooKeeper, recognize that a new controller was elected, and fall back to being a normal broker.
This process protects against a few brokers failing, but what if we have a major outage where a majority of our brokers fail? Can we restart them without creating a split brain? We can validate this using Chaos Engineering.
Using a shutdown Gremlin to restart a majority of broker nodes
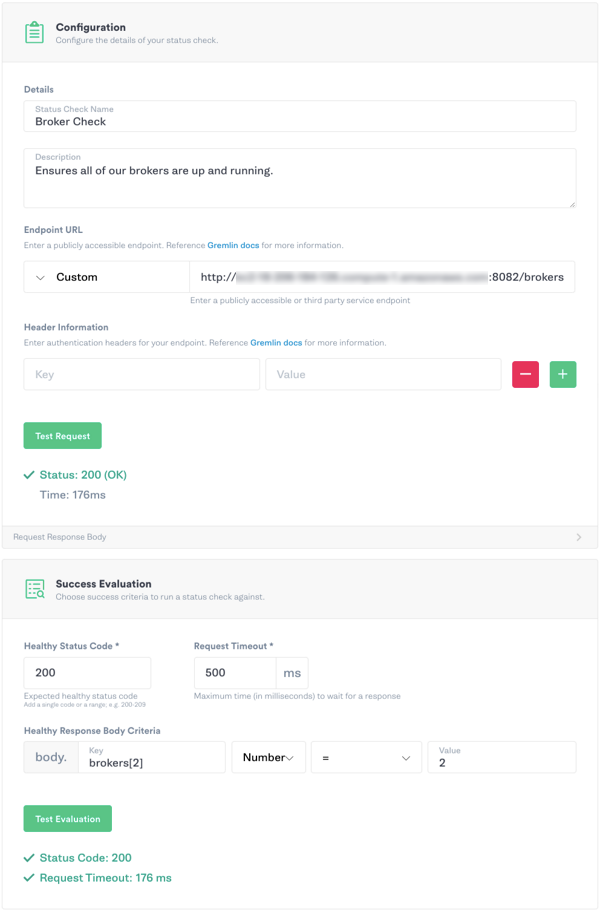
For this experiment, we’ll use a shutdown Gremlin to restart two of the three broker nodes in our cluster. Because of the potential risk this experiment poses to cluster stability (for example, we don’t want to accidentally shut down all of our ZooKeeper nodes), we want to make sure that all three of our brokers are in a healthy state before running the experiment. We’ll create a Status Check that fetches a list of healthy brokers from the Kafka Monitoring API to verify that all three brokers are up and running
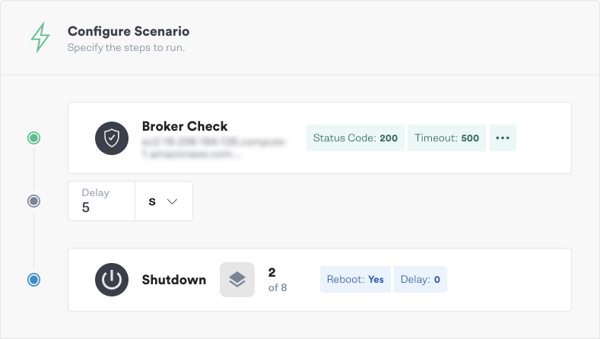
Here is our fully configured Scenario showing the Status Check and shutdown Gremlin:
Hypothesis
Kafka will experience a temporary stop in throughput, but both broker nodes will rejoin the cluster without issue.
Results
Control Center still lists three brokers, but shows that two of them are out-of-sync and have under-replicated partitions. This is expected, as the nodes have lost contact with the remaining broker and with ZooKeeper.

When the previous controller (broker 1) went offline, ZooKeeper immediately elected the remaining broker (broker 3) as the new controller. Since the two brokers restarted without exceeding ZooKeeper’s session timeout, the broker uptime chart shows them as having been continuously online. However, looking at the throughput and replica charts shows a clear impact on throughput and partition health as our message pipeline shifted to broker 3.
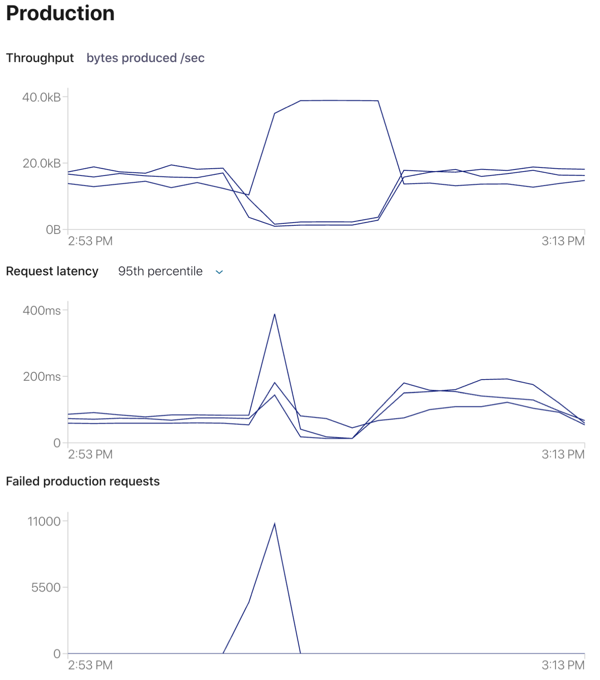
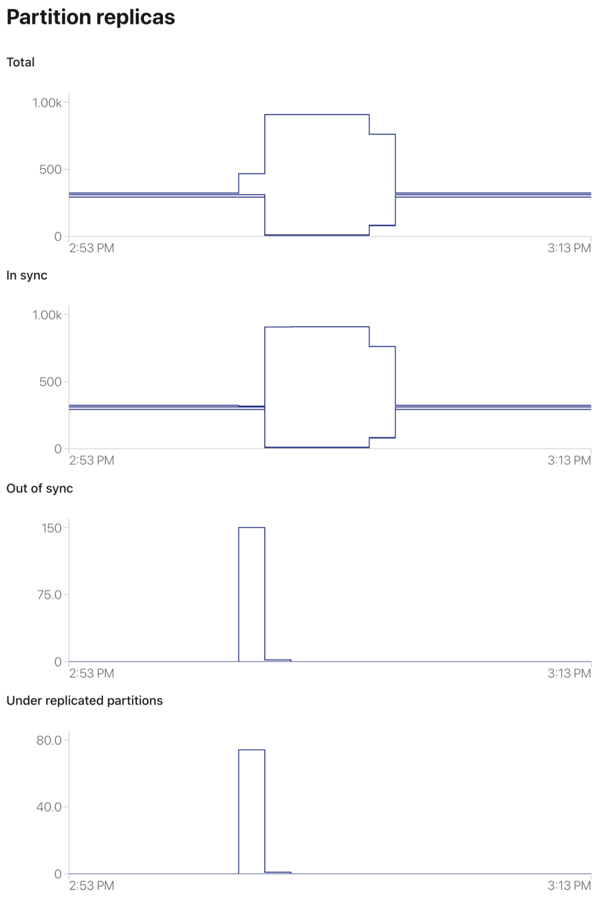
Nonetheless, our brokers rejoined the cluster without incident. From this we can conclude that our cluster can withstand temporary majority failures. Performance will drop significantly, and the cluster will need to elect new leaders, reassign partitions, and replicate data among the remaining brokers, but we won’t end up with a split brain scenario. This outcome might be different if it took longer for us to restore our brokers, so we want to be certain that we have an incident response plan in place in case of a major outage in production.
Experiment 4: ZooKeeper outage
ZooKeeper is an essential dependency of Kafka. It’s responsible for activities such as identifying brokers, electing leaders, and tracking partition distribution across brokers. A ZooKeeper outage won’t necessarily cause Kafka to fail, but it can lead to unexpected problems the longer it goes unresolved.
In one example, HubSpot experienced a ZooKeeper failure due to a high volume of requests that had backed up over time. ZooKeeper was unable to recover for several minutes, which in turn caused Kafka nodes to begin crashing. This eventually led to data corruption and teams had to manually restore backup data to servers. While this was an unusual scenario that HubSpot resolved, it underscores the importance of testing ZooKeeper and Kafka both as individual services and as a holistic service.
Using a blackhole Gremlin to simulate an Apache ZooKeeper outage
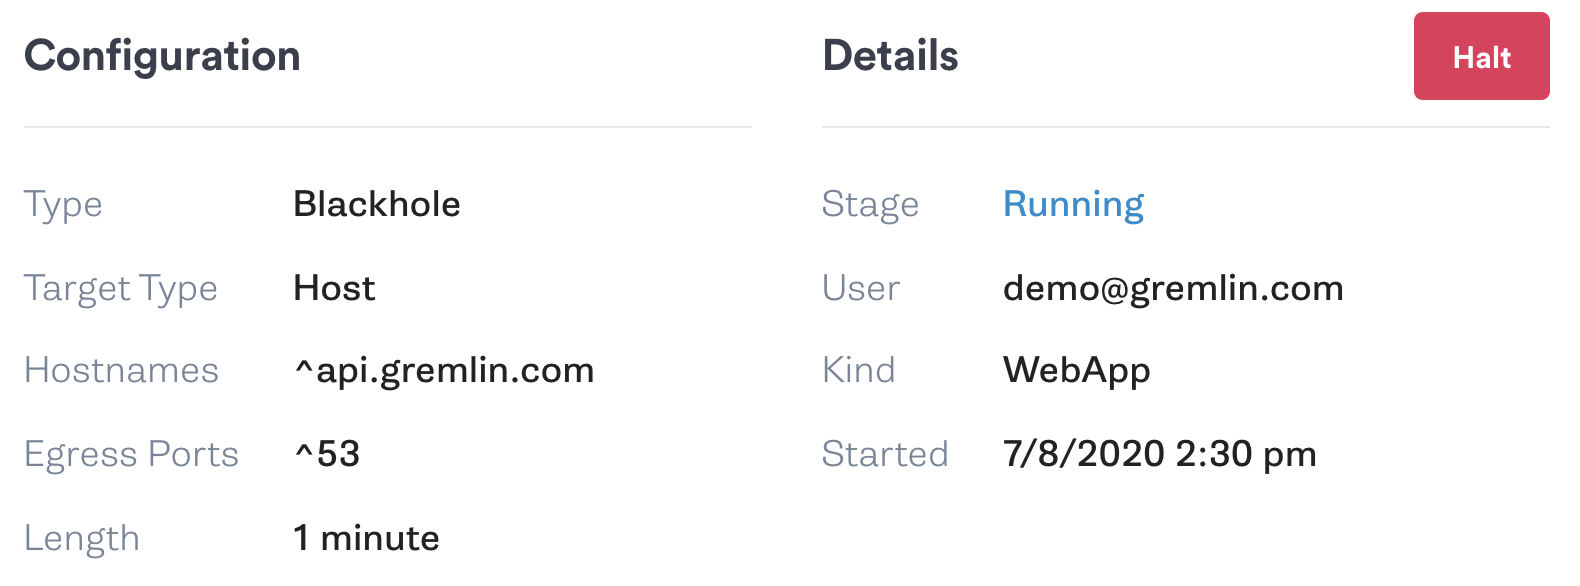
For this experiment, we want to verify that our Kafka cluster can survive an unexpected ZooKeeper outage without failing. We’ll use a blackhole Gremlin to drop all traffic to and from our ZooKeeper nodes. We’ll run this attack for five minutes while monitoring the cluster state in Control Center.
Hypothesis
Kafka can tolerate a short-term ZooKeeper outage without crashing, losing data, or corrupting data. However, any changes to cluster state won’t be resolved until ZooKeeper comes back online.
Results
Running the experiment had no result on message throughput or broker availability. As we hypothesized, we can continue producing and consuming messages without unexpected problems.
If we cause one of our brokers to fail, the broker cannot rejoin the cluster until ZooKeeper comes back online. This alone isn’t likely to cause a failure, but it can lead to another problem: cascading failures. For example, a broker failure will cause our producers to shift their load to the remaining brokers. If those brokers are close to capacity, they might fail in turn. Even if we bring our failed brokers back online, they won’t be able to join the cluster until ZooKeeper is available again.
This experiment shows that we can tolerate ZooKeeper temporarily failing, but we should nonetheless work quickly to bring it back online. We should also look for ways to mitigate the risk of a complete outage, such as distributing ZooKeeper across multiple regions for redundancy. While this will increase our operating costs and increase latency, it’s a small cost compared to having an entire cluster fail in production.
Moving forward with making Kafka more reliable
Kafka is a complex platform with a large number of interdependent components and processes. Keeping Kafka running reliably requires planning, continuous monitoring, and proactive failure testing. This doesn’t apply only to our Kafka and ZooKeeper clusters, but also to our applications that use Kafka. Chaos Engineering allows us to uncover reliability problems in our Kafka deployments in a safe and effective way. Preparing for failure today can prevent or reduce the risk and impact of failures in the future, saving our organization time, engineering effort, and the trust of our customers.
Now that we’ve shown you four different chaos experiments for Kafka, try running these and other experiments yourself by requesting a free Gremlin trial. When creating an experiment, consider the potential failure points in your own Kafka deployment—for example, the connection between your brokers and consumers—and observe how they respond to different attacks. If you uncover a problem, implement a fix and repeat the experiment to verify that it solves the problem. As your systems become more reliable, gradually increase both the magnitude (the intensity of the experiment) and the blast radius (the number of systems impacted by the experiment) so that you’re testing your entire deployment holistically.
For more ideas on chaos experiments to run on Kafka, read our tutorial What I Learned Running the Chaos Lab: Kafka Breaks.
Related


Avoid downtime. Use Gremlin to turn failure into resilience.
Gremlin empowers you to proactively root out failure before it causes downtime. See how you can harness chaos to build resilient systems by requesting a demo of Gremlin.
Get started