
Inside Gremlin: Staging Monitoring and Alerting GameDay
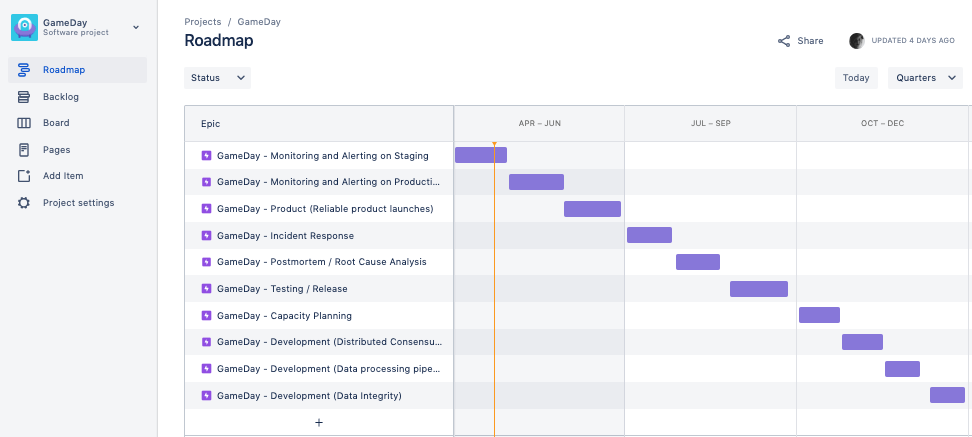
To constantly improve our own reliability and durability one of our P0 OKRs for 2019 is focused on ensuring we consistently practice impactful GameDays internally here at Gremlin. Our 2019 GameDays Roadmap is also openly available for you to view and use with your own team.
To kick off our GameDays for 2019 I decided to partner with HML (Principal Solutions Architect @ Gremlin), Matt Jacobs (Principal Software Engineer @ Gremlin) and Phil Gebhardt (Software Engineer @ Gremlin) to ensure we were set up to run the best GameDay possible. I joined Gremlin as a Principle SRE in 2017 and I recently wrote about my experiences using Chaos Engineering GameDays to improve MTTD for O’Reilly.
Gremlin GameDay Roadmap 2019
We will be walking through the first GameDay on our Gremlin GameDays roadmap; Monitoring and Alerting on Staging.
TL;DR: Staging Monitoring & Alerting GameDay
Everyone who attended our GameDay found it incredibly valuable. We identified several issues on staging that we needed to fix for our monitoring and alerting. Preparing for the GameDay was also extremely insightful, we created a new Chaos Engineering dashboard that we could use and modify on-the-fly during our GameDay.

Making GameDays a P0 OKR
To ensure everyone here @ Gremlin is focused on consistently improving availability and durability I decided to create a P0 OKR for GameDays for each quarter of 2019. I then got this approved by my boss Forni (CTO @ Gremlin). To track OKRs I prefer to create a yearly roadmap divided into quarters.
Key Result (How): Run internal GameDays (3 in Q2)
Who: Tammy
Priority: P0
OKR Grade: 😊
Ideally we would prefer to run more than 1 GameDay a quarter but because we have set this as a P0 it means we must run 1 or we fail the entire quarter. Our stretch goal is to run 1 GameDay per month. When we set a P0 this means it must happen, other work will get pushed aside and we will do whatever is required to make sure this P0 is successfully delivered.
Prioritizing Engineering Work
I personally prefer to only create OKRs for P0 and P1 work. P2 work is tracked in a backlog and we pick up this work only when all P0 and P1 work for the quarter is on-track to be successfully delivered. By definition, there should be no P0s at the end of the quarter or you fail the quarter.
The levels below are inspired by the work Google has shared on prioritizing engineering work:
Priority: P0
Description: This work must be addressed within the timeframe specified with as many resources as required. It is a critical piece of work that must be successfully delivered. This work takes priority over all P1s and P2s, other work that is of lower priority will be postponed for this work to be successfully delivered.
Priority: P1
Description: This work should be delivered within the specified timeframe. The impact of this work is core to the company’s mission.
Priority: P2
Description: An issue that needs to be addressed on a reasonable timescale. This work often has a reasonable workaround, or is a request for lower priority work from another team. P2 is the default priority level.
If you would like to learn more about setting OKRs and prioritizing engineering work I recommend:
- Measure What Matters by John Doerr: https://www.amazon.com/Measure-What-Matters-Google-Foundation/dp/0525536221
- Google Issue Tracker Priority Levels by Google : https://developers.google.com/issue-tracker/concepts/issues
Preparing for our Staging Monitoring & Alerting GameDay
To prepare for this GameDay there were a number of tasks that needed to be accomplished. We met for 1 hour to discuss these items 1 week before the GameDay. These tasks are listed below:
- Create a public #gamedays Slack channel
- Create a zoom room for GameDays
- Decide on the scope of the GameDay
- Create an agenda for the GameDay
- Create a calendar invite for the GameDay and invite the whole company to watch
- Post in #general to invite everyone to join the #gamedays Slack channel
- Create a Datadog Dashboard for the GameDay
- Ensure appropriate team members have access to software required for the GameDay
GameDay Scope
We decided that the scope for this GameDay would be Staging Monitoring & Alerting.
__
Agenda for GameDay
We created an agenda for our GameDay and shared this with our entire team via Slack and in the calendar invite.
10:00-10:10 - Intro to GameDays
10:10-10:40 - Review gameday workbook
10:40-11:40 - GameDay
11:40-12:00 - Q&A
12:00-12:30 - Buffer
Running our Staging Monitoring & Alerting GameDay
Intro to GameDays (10:00-10:10)
To kick off our GameDay HML gave a presentation on GameDays. He explained that GameDays are dedicated time to come together to gain insights, an opportunity to execute one or more experiments, time to prove or disprove a hypothesis and time to test the resilience of your application and architecture.
Review gameday workbook (10:10-10:40)
Before the GameDay we filled out the entire GameDay workbook. This is a workbook HML created for our Gremlin customers, we also use it internally for our own GameDays.
During this time we had the following objectives:
- Cover what experiments we would run and construct a detailed hypothesis on what we expect to observe
- Cover what failure we will inject
- Cover what type of tooling we need for this experiment (e.g. Gremlin, Datadog & Sentry)
Experiments
The following experiments shall be executed. Unless explicitly stated as a pre-condition to the experiment, it is expected that system is running in a normal steady state.
Failure Scenario 1: API Server Shutdown
Background: This simulates a server crashing or taken out of service due to some ASG action like failed health-checks
Failure Scenario 2: SNS unreachable from API Server
Background: This simulates an outage with the Amazon Simple notification Service (SNS)
Failure Scenario 3: Elevated Database Latency from API Server
Background: This simulates unpredictable latency spike with the Amazon DynamoDB service.
After we had decided on the experiments we created a new Datadog Dashboard for the GameDay.
Staging Monitoring & Alerting GameDay Dashboard
We created a GameDay dashboard to specifically monitor our Staging Environment Control Plane. We were then ready to use this dashboard to monitor Chaos Engineering attacks in real-time. Before the GameDay we made sure we were monitoring API Metrics, Database Metrics and System Metrics for our Staging Control Plane.
Next, let’s walk through each of the Dashboard components.
API Metrics
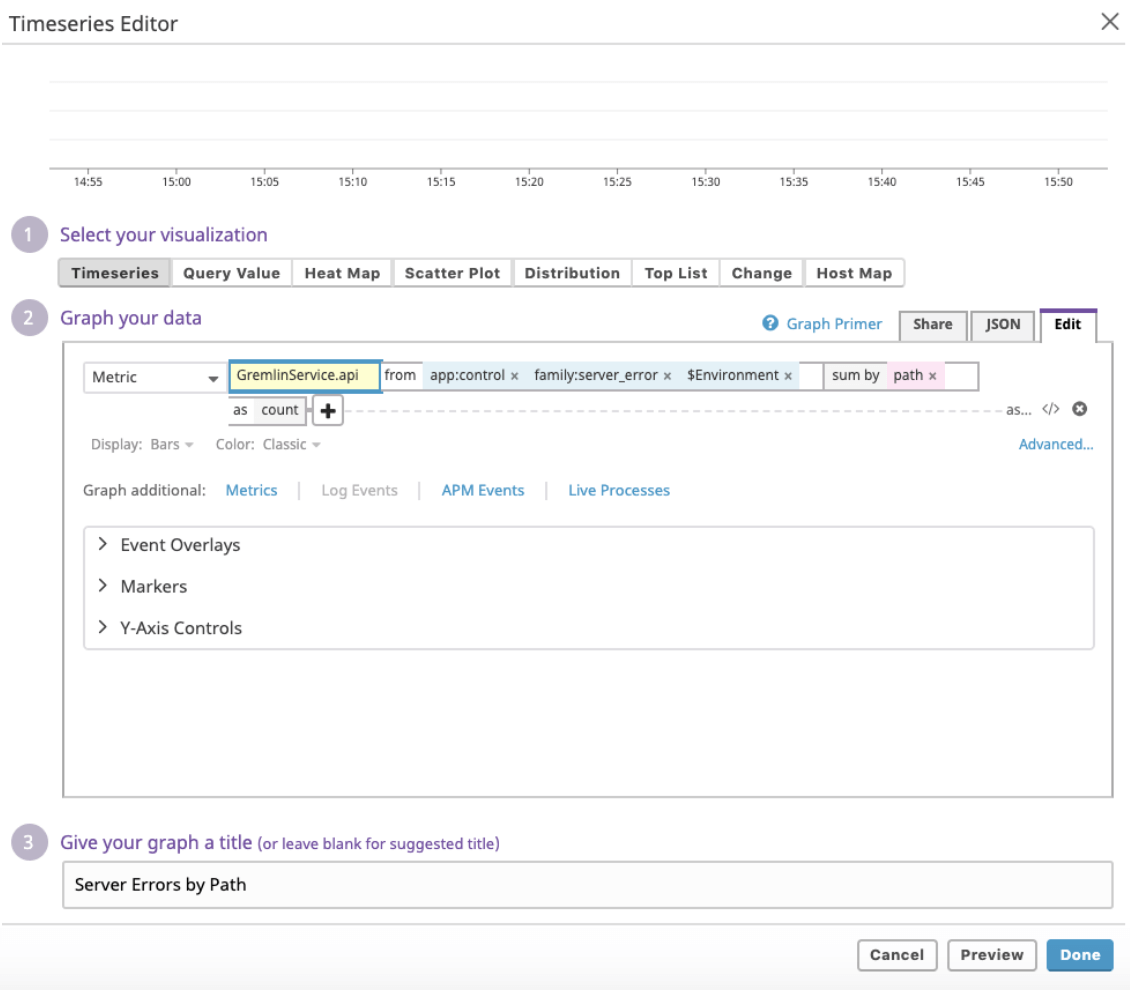
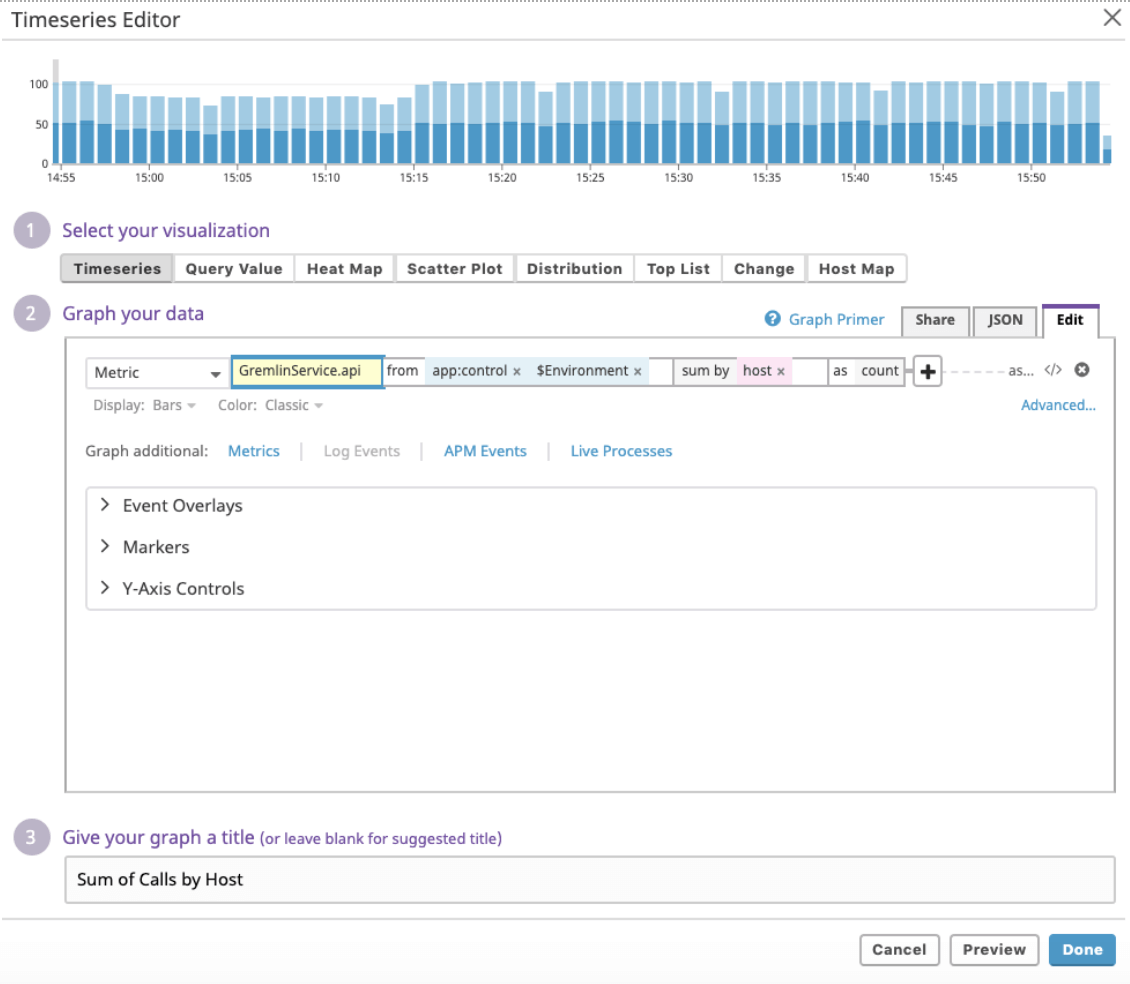
To ensure we have visibility of our API we measure sum of calls by path, server errors by path, latency by path, error rate, rum of calls by host and sum of client errors by status.
The overall API metrics dashboard is viewable in Datadog as follows:

Next we will walk through how we calculate each metric to ensure we are able to create a Control Plane API overview dashboard for our Staging environment.
API - sum of calls by path

API - Server errors by path
API - Latency by path

API - Error rate

API - Sum of calls by host
API - Sum of client errors by status

Database Metrics
To ensure we have visibility of our Staging Database (AWS DynamoDB) we measure sum of calls by table, errors by table, latency by table and error rate.
The overall Database metrics dashboard is viewable in Datadog as follows:

Next we will walk through how we calculate each metric to ensure we are able to create a Control Plane Database overview dashboard for our Staging environment.
Database - sum of calls by table

Database - errors by table

Database - latency by table

Database - error rate

System Metrics
To ensure we have visibility of our Staging System Metrics (AWS EC2) we measure Idle CPU by host, free memory by host and uptime by host.
The overall System metrics dashboard is viewable in Datadog as follows:

System Metrics - Idle CPU by host

System Metrics - free memory by host

System Metrics - uptime by host

GameDay (10:40-11:40)
This GameDay ran for 1 hour, we recommend 1 hour as the shortest amount of time to run a GameDay since it enables you to run through 3 different experiments (20 minutes each) and gain a large amount of value from your team’s time.
Experiment 1 (10:40 - 11:00)
Failure Scenario #1: API Server Shutdown
Hypothesis
When a server is shutdown, our AutoScaling Group (ASG) automatically detects this after a short interval (how long?) and will terminate the server. While the server starts the termination process, the ASG will also launch a new server to take its place. This whole process should take less than 5 minutes.
When a server is rebooted, it is possible that it reboots so fast that the ASG never notices, and the system will continue to behave normally.
In both scenarios, there should be no behavior detected by end-users. (No failed API requests or elevated response times)
Gremlin Attack Scope (Blast Radius)
Target: Tag service:gremlin-api, random 1
Gremlin: State > Shutdown
Attack Parameters: Delay for 0m, Reboot (one with, one without)
Results
Observations: Failed hypothesis, our AutoScalingGroup and load balancer were too slow to pick up on shutdown.
Follow up Actions: Examine current health checks, tune them such that instances are marked unhealthy sooner.
Expected - N
Detected - Y
Handled - Y
Ready to Automate - Y
Experiment 2 (11:00 - 11:20)
Failure Scenario #2: SNS Unreachable from API Server
Hypothesis
When Amazon Simple Notification Service (SNS) is unreachable from our API servers, we are not able to dispatch events to out event pipeline. As a result, some Tier2/Tier3 services will behave slowly or not at all (e.g. Slack Integration, Mixpanel, Salesforce, Datadog)
When a single zone is targeted, we can expect some failures of the mentioned services, but not 100% failure.
Gremlin Attack Scope (Blast Radius)
Target: Tag service:gremlin-api, [zone:us-west-1a], Random 100%
Gremlin: Network > Blackhole
Attack Parameters: Length 60s (1m) → 300s (5m), Hostname sns.us-west-1.amazonaws.com
Results
Observations: Passed the first experiment (60s for 1min). Didn’t pass the second (300s for 5min)
Follow up Actions: Hard to know which attack is which because there is no GUID displayed with the slack integration. Improve SNS monitoring https://app.datadoghq.com/monitors/
Expected - N
Detected - N
Handled - N
Ready to Automate - N
Experiment 3 (11:20 - 11:40)
Failure Scenario #3: Slow Response from Database
Hypothesis
When our database is slow, our API server will also behave slower than normal. In many cases, API latency will be much higher in proportion to the increased Database latency as most API requests trigger more than one Database call.
Our database calls time out when they fail to connect after 500ms, or if the total request time takes longer than 1.5s. When this happens, we can expect the API to return a status of 500 (Internal Server Error)
Gremlin Attack Scope (Blast Radius)
Target: Tag service:gremlin-api, Random 50% →100%
Gremlin: Network > Latency
Attack Parameters: Length 60s (1m) → 300s (5m), Milliseconds 100ms → 200ms, Hostname dynamodb.us-west-1.amazonaws.com
Results
Observations
- We have a failure in the UI, completed attacks aren’t showing up (saw a “retry attacks” error link)
- 4 database failures and 4 API failures... 2% error rate
- Errors were associated with server we impacted.. We are safe to dial up to 100% of hosts after attacking 50%
- With the second attack (100%) team reports won’t load even after attack is over ...we are making a lot of database calls… will take longer to recover from a latency spike (unsure how long it takes to recover.. 11:36:57 attack ends - 11:41 team reports recovers… take note that production has much more data in datadog for reporting so it will likely take longer to recover).
Follow up Actions: Identify ways to improve time to recovery (MTTR) after a latency injection on DynamoDB.
Expected - N
Detected - Y
Handled - Y
Ready to Automate - N
Q&A (11:40-12:00)
We made sure to add 30min for Q&A after the GameDay. This time is available for anyone across the company to ask questions. We find that we always use Q&A time as new team members are constantly joining the team and there are always questions.
Buffer (12:00-12:30)
We added an additional 30min as a buffer. This is useful because teams may need to dive deeper into unexpected outcomes of experiments.
Post Staging Monitoring & Alerting GameDay
Immediately following the GameDay it is important to write up a one-page Executive Summary and send this out to key stakeholders.
Below we have shared our Executive Summary from this GameDay:
GameDay One-Page Executive Summary
Date: March 22 2019
Organizers: Tammy, HML, Phil & Matt Jacobs
Team: Engineering
Application / Service: Monitoring & Alerting
Top 3 Gameday Key Findings
- It took longer than 5 minutes to detect and correct an instance being shutdown. Our AutoScalingGroup and health check policies are slower than we thought.
- SNS is not a breaking component of our control plane.
- When we inject latency the attack events post out of order in Slack and it is hard to know which attack starting message is paired with an attack ending message when you have multiple attacks happening at the same time. (e.g. to improve this we could possibly display the last 4 characters of the GUID).
Top 3 Next Steps Post-Gameday
- Review health checks for instances that are shutdown so we meet the goal of being notified in monitoring (Datadog) within 5 mins (P0)
- Create a Production version of the Staging GameDay Dashboard (P0)
- Add a monitor for failure to deliver to SNS (P1)
Experiments Summary
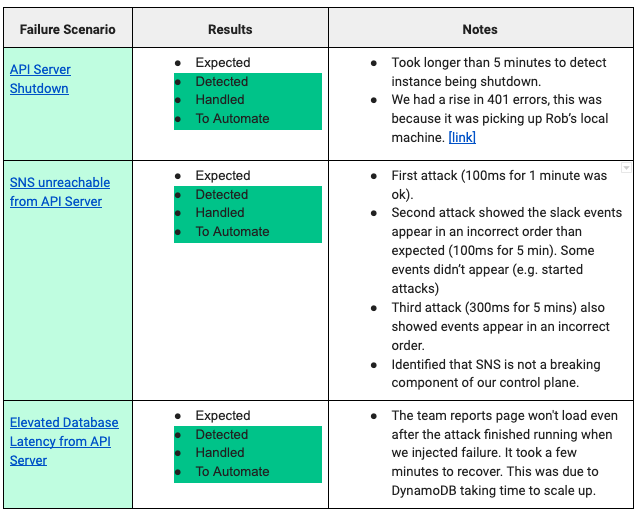
GameDay Next Steps - High Priority Action Items
After the GameDay we made sure to prioritise, track and successfully complete the most important action items that we needed to successfully achieve before the next GameDay. We recommend only selecting 3 high priority action items. You should add the remaining action items to your general Engineering backlog for GameDays.
- Review health checks for instances that are shutdown so we meet the goal of being notified in monitoring (Datadog) within 5 mins (P0)
- Create a Production version of the Staging GameDay Dashboard (P0)
- Add a monitor for failure to deliver to SNS (P1)
We then added our top 3 high priority GameDay action items to the appropriate epic in our GameDay project. These action items were assigned to specific people on our teams.
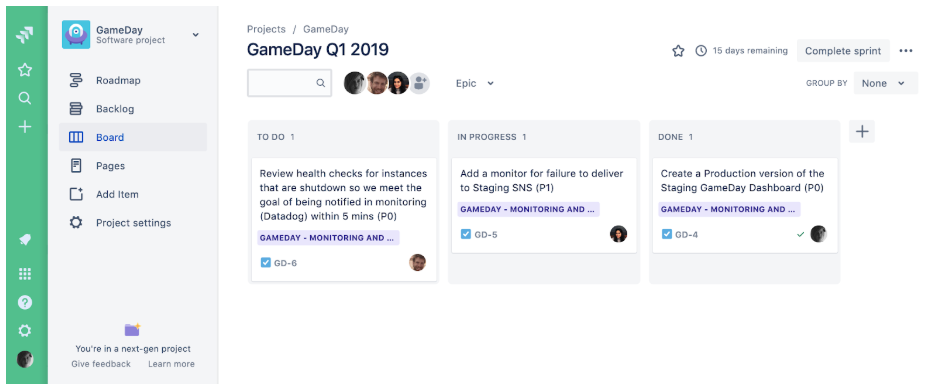
Let’s discuss each of these high priority action items in more detail.
Review health checks for instances that are shutdown so we meet the goal of being notified in monitoring (Datadog) within 5 mins (P0)
We have a few health checks that we use to track instances. One of the main ones we use is "Number of instances has changed significantly (heartbeat count)".

Create a Production version of the Staging GameDay Dashboard (P0)
This action item was very simple and quick for us to achieve. You can use Template Variables in Datadog to quickly create a Production version of the same Staging dashboard. To enable us to flip between our Staging and Production dashboards we updated the Datadog dashboard to use $Environment as a template variable. You can see the $Environment dropdown in action below:

Add a monitor for failure to deliver to Staging SNS (P1)
We were able to add this monitor during the GameDay. We identified during the experiment that it did not exist and Harshita went ahead and created it.

What’s the next GameDay?
Next we will be running a Production Monitoring and Alerting GameDay.
We will perform the same experiments that we performed during this GameDay on our Production Environment.
Want to run your own GameDay? Sign up for Gremlin and join us in the Chaos Engineering Slack to get started.
Related


Avoid downtime. Use Gremlin to turn failure into resilience.
Gremlin empowers you to proactively root out failure before it causes downtime. See how you can harness chaos to build resilient systems by requesting a demo of Gremlin.
Get started