

Introduction In this tutorial, we'll show you how to run a Chaos Engineering experiment on a serverless application…

Andre Newman
Sr. Reliability Specialist
Gremlin is a simple, safe and secure service for performing Chaos Engineering experiments through a SaaS-based platform. Prometheus is an open-source systems monitoring and alerting toolkit originally built at SoundCloud. Prometheus is now a standalone open source project and maintained independently of any company. Prometheus joined the Cloud Native Computing Foundation in 2016 as the second hosted project, after Kubernetes. Datadog is a monitoring service for cloud-scale applications, providing monitoring of servers, databases, tools, and services, through a SaaS-based data analytics platform.
This tutorial shows:
Prometheus’ storage model groups ingested samples into blocks of two hours. Each two hour block contains one or more chunk files that contain all time series samples for that window of time. The block for currently incoming samples is kept in memory and not fully persisted. It is secured against crashes by a WAL (write-ahead-log) that can be replayed when the prometheus server restarts after a crash. The limitation of local storage is that it is not clustered or replicated. Thus, it is not scalable or durable in the face or disk or node outages. There is a open source project called Thanos which aims to be a highly available Prometheus setup with long term storage capabilities. For the purposes of this tutorial we will run Chaos Engineering experiments on the Prometheus server running inside a Docker container. The Chaos Engineering experiment we will perform is a shutdown of the Prometheus Docker container.

Image source: Prometheus Overview
In this step, you’ll install Docker.
Add Docker’s official GPG key:
1curl -fsSL https://download.docker.com/linux/ubuntu/gpg | sudo apt-key add -
Use the following command to set up the stable repository.
1sudo add-apt-repository "deb [arch=amd64] https://download.docker.com/linux/ubuntu $(lsb_release -cs) stable"
Update the apt package index:
1sudo apt-get update
Make sure you are about to install from the Docker repo instead of the default Ubuntu 16.04 repo:
1apt-cache policy docker-ce
Install the latest version of Docker CE:
1sudo apt-get install docker-ce
Docker should now be installed, the daemon started, and the process enabled to start on boot. Check that it is running:
1sudo systemctl status docker
Type q to return to the prompt.
Make sure you are in the Docker usergroup, replace tammy with your username:
1sudo usermod -aG docker tammy
Next we will create an Prometheus container and monitor the new container directly by joining the container’s pid namespace.
Prometheus is an open-source systems monitoring and alerting toolkit.
First we'll create a directory in /etc for Prometheus' configuration files and a directory in /var/lib for its data.
1sudo mkdir /etc/prometheus
1sudo mkdir /var/lib/prometheus
First create a Prometheus configuration file on the host filesystem:
1vim /etc/prometheus/prometheus.yml
Add the following contents to the yml file, replace the IP address in red with your own IP address:
1# A scrape configuration scraping a Node Exporter and the Prometheus server# itself.scrape_configs: # Scrape Prometheus itself every 5 seconds. - job_name: 'prometheus' scrape_interval: 5s target_groups: - targets: ['localhost:9090'] # Scrape the Node Exporter every 5 seconds. - job_name: 'node' scrape_interval: 5s target_groups: - targets: ['68.183.116.87:9100']
Start the Prometheus Docker container with your configuration file:
1docker run -d -p 9090:9090 prom/prometheus
List all running Docker containers using the following command:
1docker ps
To start the Node Exporter on port 9100 using Docker:
1docker run -d -p 9100:9100 -v "/proc:/host/proc" -v "/sys:/host/sys" -v "/:/rootfs" --net="host" prom/node-exporter
Now you will be able to view your Prometheus metrics.
The Prometheus server should now automatically start scraping the Node Exporter.
You can also verify that Prometheus is serving metrics about itself by navigating to its metrics endpoint, e.g. http://68.183.116.87:9090/metrics, replacing the IP Address with your own.
To graph expressions, navigate to http://68.183.116.87:9090/graph and use the "Graph" tab, replacing the IP Address with your own.
For example, enter the following expression to graph the per-second rate of chunks being created in the self-scraped Prometheus:
1rate(prometheus_tsdb_head_chunks_created_total[1m])
You will a graph similar to below:

Experiment with the graph range parameters and other settings.
After you have created your Gremlin account (sign up here) you will need to find your Gremlin Daemon credentials. Login to the Gremlin App using your Company name and sign-on credentials. These were emailed to you when you signed up to start using Gremlin.
Navigate to Team Settings and click on your Team.
Store your Gremlin agent credentials as environment variables, for example:
1export GREMLIN_TEAM_ID=3f242793-018a-5ad5-9211-fb958f8dc084
1export GREMLIN_TEAM_SECRET=eac3a31b-4a6f-6778-1bdb813a6fdc
Next run the Gremlin Daemon in a Container.
Use docker run to pull the official Gremlin Docker image and run the Gremlin daemon:
1sudo docker run -d \ --net=host \ --pid=host \ --cap-add=NET_ADMIN \ --cap-add=SYS_BOOT \ --cap-add=SYS_TIME \ --cap-add=KILL \ -e GREMLIN_TEAM_ID="${GREMLIN_TEAM_ID}" \ -e GREMLIN_TEAM_SECRET="${GREMLIN_TEAM_SECRET}" \ -v /var/run/docker.sock:/var/run/docker.sock \ -v /var/log/gremlin:/var/log/gremlin \ -v /var/lib/gremlin:/var/lib/gremlin \ gremlin/gremlin daemon
Use docker ps to see all running Docker containers:
1sudo docker ps
1CONTAINER ID IMAGE COMMAND CREATED STATUS PORTS NAMESb281e749ac33 gremlin/gremlin "/entrypoint.sh daem…" 5 seconds ago Up 4 seconds relaxed_heisenberg
Jump into your Gremlin container with an interactive shell (replace b281e749ac33 with the real ID of your Gremlin container):
1sudo docker exec -it b281e749ac33 /bin/bash
From within the container, check out the available attack types:
1gremlin help attack-container
1Usage: gremlin attack-container CONTAINER TYPE [type-specific-options]Type "gremlin help attack-container TYPE" for more details: blackhole # An attack which drops all matching network traffic cpu # An attack which consumes CPU resources io # An attack which consumes IO resources latency # An attack which adds latency to all matching network traffic memory # An attack which consumes memory packet_loss # An attack which introduces packet loss to all matching network traffic shutdown # An attack which forces the target to shutdown dns # An attack which blocks access to DNS servers time_travel # An attack which changes the system time. disk # An attack which consumes disk resources process_killer # An attack which kills the specified process
Then exit the container.
To install Datadog in a Docker container you can use the Datadog Docker easy one-step install.
Run the following command, replacing the item in red with your own API key:
1docker run -d --name dd-agent -v /var/run/docker.sock:/var/run/docker.sock:ro -v /proc/:/host/proc/:ro -v /sys/fs/cgroup/:/host/sys/fs/cgroup:ro -e DD_API_KEY=7cfe87ac24e0ce166be9c96aea1f3f88 datadog/agent:latest
It will take a few minutes for Datadog to spin up the Datadog container, collect metrics on your existing containers and display them in the Datadog App.
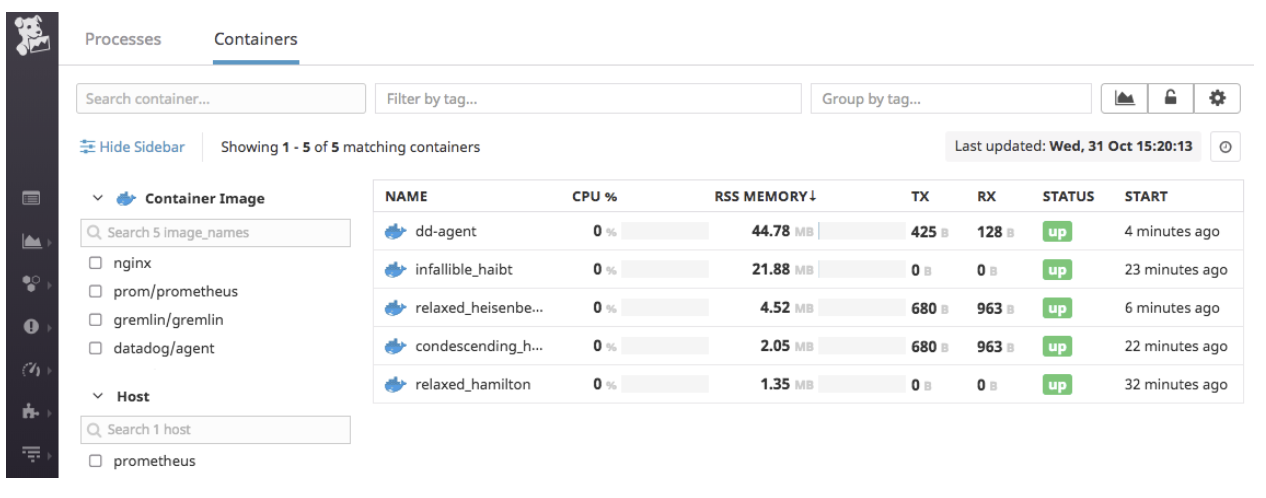
View your Docker Containers in Datadog, you should see the following on the host Dashboard:
We will use the Gremlin CLI attack command to create a CPU attack.
Now use the Gremlin CLI (gremlin) to run a CPU attack from within a Gremlin container:
1sudo docker run -i \ --net=host \ --pid=host \ --cap-add=NET_ADMIN \ --cap-add=SYS_BOOT \ --cap-add=SYS_TIME \ --cap-add=KILL \ -e GREMLIN_TEAM_ID="${GREMLIN_TEAM_ID}" \ -e GREMLIN_TEAM_CERTIFICATE_OR_FILE="${GREMLIN_TEAM_CERTIFICATE_OR_FILE}" \ -e GREMLIN_TEAM_PRIVATE_KEY_OR_FILE="${GREMLIN_TEAM_PRIVATE_KEY_OR_FILE}" \ -v /var/run/docker.sock:/var/run/docker.sock \ -v /var/log/gremlin:/var/log/gremlin \ -v /var/lib/gremlin:/var/lib/gremlin \ gremlin/gremlin attack-container 2bb6286816d3 shutdown
This attack will shutdown the Prometheus container and it will not be automatically recreated.
Use docker ps to confirm that the Prometheus container is no longer running:
1docker ps
1CONTAINER ID IMAGE COMMAND CREATED STATUS PORTS NAMES
1d2c266591df4 datadog/agent:latest "/init" About an hour ago Up About an hour (healthy) 8125/udp, 8126/tcp dd-agent
1b281e749ac33 gremlin/gremlin "/entrypoint.sh daem…" About an hour ago Up About an hour relaxed_heisenberg
15b793e7e97bf prom/node-exporter "/bin/node_exporter" About an hour ago Up About an hour condescending_heisenberg
1e030fc006904 nginx "nginx -g 'daemon of…" About an hour ago Up About an hour 80/tcp relaxed_hamilton
To create Docker containers that restart automatically you will need to you docker’s restart functionality. Start Prometheus again using the following Docker command, this includes --restart unless-stopped which will ensure your Prometheus Docker container is restarted.
1docker run -d -p 9090:9090 --restart unless-stopped prom/prometheus
Use docker ps to confirm that the Prometheus container is now running again:
1docker ps
1CONTAINER ID IMAGE COMMAND CREATED STATUS PORTS NAMES
13ce13dadb8ed prom/prometheus "/bin/prometheus --c…" About a minute ago Up 8 seconds 0.0.0.0:9090->9090/tcp keen_babbage
1d2c266591df4 datadog/agent:latest "/init" About an hour ago Up About an hour (healthy) 8125/udp, 8126/tcp dd-agent
1b281e749ac33 gremlin/gremlin "/entrypoint.sh daem…" About an hour ago Up About an hour relaxed_heisenberg
15b793e7e97bf prom/node-exporter "/bin/node_exporter" About an hour ago Up About an hour condescending_heisenberg
1e030fc006904 nginx "nginx -g 'daemon of…" About an hour ago Up About an hour 80/tcp relaxed_hamilton
The average lifespan of a container is 2.5 days, visit the Docker guide on starting containers automatically to learn more. You should not be getting paged for containers or hosts being down. You should be handling this in an automated manner.
There are many Chaos Engineering experiments you could possibly run on your Prometheus infrastructure:
We encourage you to run these Chaos Engineering experiments and share your findings! You can get access to Gremlin.
This tutorial has explored how to install Prometheus and Gremlin in Docker containers for your Chaos Engineering experiments. We then ran a shutdown Chaos Engineering experiment on the Prometheus container using the Gremlin Shutdown attack.
Gremlin empowers you to proactively root out failure before it causes downtime. See how you can harness chaos to build resilient systems by requesting a demo of Gremlin.
Get started