

Introduction In this tutorial, we'll show you how to run a Chaos Engineering experiment on a serverless application…

Andre Newman
Sr. Reliability Specialist

Gremlin is a simple, safe and secure service for performing Chaos Engineering experiments through a SaaS-based platform. Elasticsearch is a search engine based on Apache Lucene. It provides a distributed, multitenant-capable full-text search engine with an HTTP web interface and schema-free JSON documents. Datadog is a monitoring service for cloud-scale applications, providing monitoring of servers, databases, tools, and services, through a SaaS-based data analytics platform. Datadog provides an integration to monitor Elasticsearch.
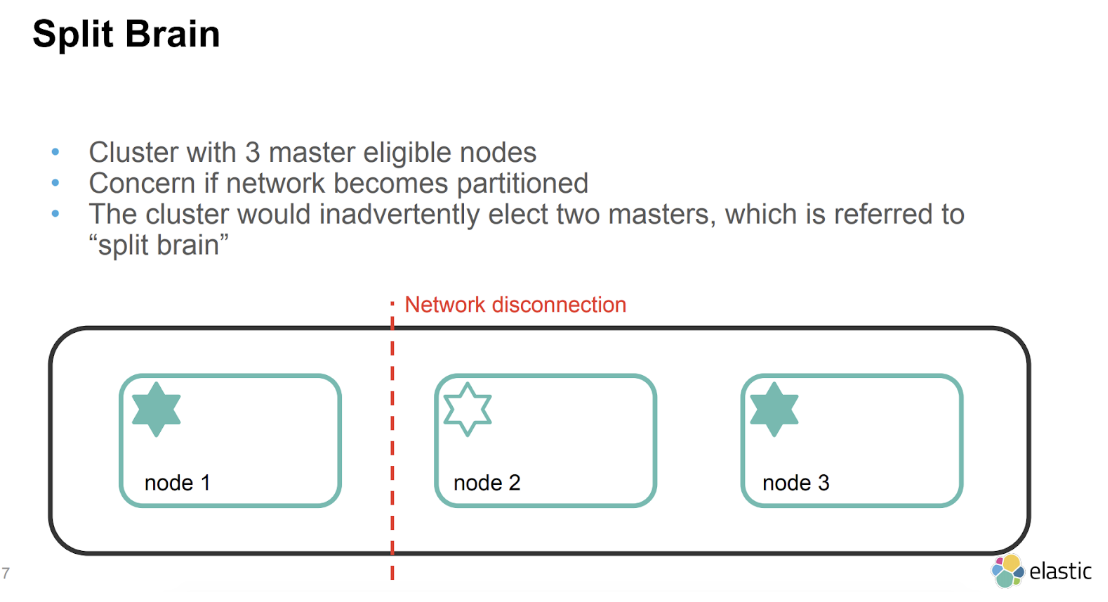
For the purposes of this tutorial we will run Chaos Engineering experiments on the Elasticsearch nodes to reproduce an issue referred to as “split brain”. We will then explain how to avoid “split brain” and run an additional Chaos Engineering experiment to ensure it does not occur. The Chaos Engineering experiment we will perform is a Gremlin Shutdown attack on one Elasticsearch node.
Split brain indicates data inconsistencies originating from separate data sets with overlap in scope, either because of servers in a network design, or a failure condition based on servers not communicating and synchronizing their data to each other. This last case is also commonly referred to as a network partition.
Source: Elasticsearch architecture best practices - by Eric Westberg, Elastic
To complete this tutorial you will need the following:
You will also need to install the following on each of your 3 cloud infrastructure hosts. This will enable you to run your Chaos Engineering experiments.
This tutorial will walk you through the required steps to run the Elasticsearch Split Brain Chaos Engineering experiment.
We will use an Ansible Playbook to automatically create /etc/hosts entries on each host that resolves each VPN server's inventory hostname to its VPN IP address.
First you will need to install Ansible on your local machine, you can use homebrew to do this:
1brew install ansible
On your local machine, use git clone to download a copy of the Playbook. We'll clone it to our home directory:
1cd ~
1git clone https://github.com/thisismitch/ansible-tinc
Now change to the newly-downloaded ansible-tinc directory:
1cd ansible-tinc
Before running the Playbook, you must create a hosts file that contains information about the hosts you want to include in your Tinc VPN.
1vim ~/ansible-tinc/hosts
Enter your own vpn configuration in the~/ansible-tinc/hosts file, an example is provided below:
1[vpn]node01 vpn_ip=10.0.0.1 ansible_host=165.227.185.205node02 vpn_ip=10.0.0.2 ansible_host=104.248.1.194node03 vpn_ip=10.0.0.3 ansible_host=104.248.1.100[vpn:vars]ansible_python_interpreter=/usr/bin/python3[removevpn]
Once your hosts file contains all of the servers you want to include in your VPN, save your changes.
At this point, you should test that Ansible can connect to all of the hosts in your inventory file:
1ansible all -m ping
You should see a "SUCCESS" message similar to below:
1node01 | SUCCESS => {\ "changed": false,\ "ping": "pong"}node03 | SUCCESS => {\ "changed": false,\ "ping": "pong"}node02 | SUCCESS => {\ "changed": false,\ "ping": "pong"=}
Before running the Playbook, you may want to review the contents of the /group_vars/all file:
1cat /group_vars/all
You will see the following:
1netname: nyc3physical_ip: "{{ ansible_eth1.ipv4.address }}"vpn_interface: tun0vpn_netmask: 255.255.255.0vpn_subnet_cidr_netmask: 32
Next we will set up the VPN across your hosts by running the Playbook.
From the ansible-tinc directory, run this command to run the Playbook:
1ansible-playbook site.yml
While the Playbook runs, it should provide the output of each task that is executed. If successful, it will appear as below:
1PLAY RECAP ********************************************************************************node01 : ok=18 changed=15 unreachable=0 failed=0node02 : ok=18 changed=15 unreachable=0 failed=0node03 : ok=18 changed=15 unreachable=0 failed=0
All of the hosts in the inventory file should now be able to communicate with each other over the VPN network.
Install Java 8 on all 3 of your Elasticsearch hosts.
Add the Oracle Java PPA to apt:
1sudo add-apt-repository -y ppa:webupd8team/java
Update your apt package database:
1sudo apt-get update
Install the latest stable version of Oracle Java 8 with this command (and accept the license agreement that pops up):
1sudo apt-get -y install oracle-java8-installer
Be sure to repeat this step on all of your Elasticsearch servers.
Now that Java 8 is installed, let's install ElasticSearch.
Elasticsearch can be installed with a package manager by adding Elastic's package source list. Complete this step on all of your Elasticsearch servers.
Run the following command to import the Elasticsearch public GPG key into apt:
1wget -qO - https://packages.elastic.co/GPG-KEY-elasticsearch | sudo apt-key add -
Create the Elasticsearch source list:
1echo "deb http://packages.elastic.co/elasticsearch/2.x/debian stable main" | sudo tee -a /etc/apt/sources.list.d/elasticsearch-2.x.list
Update your apt package database:
1sudo apt-get update
Install Elasticsearch:
1sudo apt-get -y install elasticsearch
Elasticsearch is now installed but it needs to be configured before you can use it.
Open the Elasticsearch configuration file for editing:
1vim /etc/elasticsearch/elasticsearch.yml
Because our VPN interface is named "tun0" on all of our servers, we will configure all of our servers with the same line:
1network.host: [_tun0_, _local_]
Note the addition of "_local_", this will allow you to use the Elasticsearch HTTP API locally by sending requests to localhost.
Next, set the name of your cluster
1cluster.name: production
Next, we will set the name of each node.
1node.name: ${HOSTNAME}
Next, you will need to configure an initial list of nodes that will be contacted to discover and create a cluster.
1discovery.zen.ping.unicast.hosts: ["10.0.0.1", "10.0.0.2", "10.0.0.3"]
Your servers are now configured to form a basic Elasticsearch cluster.
Save and exit elasticsearch.yml.
Now start Elasticsearch:
1sudo service elasticsearch restart
Then run this command to start Elasticsearch on boot up:
1sudo update-rc.d elasticsearch defaults 95 10
Repeat these steps on all of your Elasticsearch hosts.
To check state from each of your Elasticsearch hosts, run the following command on each host:
1curl -X GET 'http://localhost:9200'
You should see the following:
1{ "name" : "elasticsearch-03", "cluster_name" : "production", "cluster_uuid" : "q84ze4j2TDSrYDOfw-EF8g", "version" : {\ "number" : "2.4.6",\ "build_hash" : "5376dca9f70f3abef96a77f4bb22720ace8240fd",\ "build_timestamp" : "2017-07-18T12:17:44Z",\ "build_snapshot" : false,\ "lucene_version" : "5.5.4" }, "tagline" : "You Know, for Search"}
To check cluster state from your Elasticsearch hosts, run the following command:
1curl -XGET 'http://localhost:9200/_cluster/state?pretty'
You will see the following:
1{ "cluster_name" : "production", "version" : 11, "state_uuid" : "If64YGVST_2AvoxvK_vC8Q", "master_node" : "6wQnJ1DfQL2T8ePNrXIUsQ", "blocks" : { }, "nodes" : {\ "6wQnJ1DfQL2T8ePNrXIUsQ" : {\ "name" : "elasticsearch-01",\ "transport_address" : "10.0.0.1:9300",\ "attributes" : { }\ },\ "sBGUifwKTCOK6DtFRAP2bA" : {\ "name" : "elasticsearch-03",\ "transport_address" : "10.0.0.3:9300",\ "attributes" : { }\ },\ "x3WfO4aFSN6da6O7A18ljQ" : {\ "name" : "elasticsearch-02",\ "transport_address" : "10.0.0.2:9300",\ "attributes" : { }\ } }, "metadata" : {\ "cluster_uuid" : "q84ze4j2TDSrYDOfw-EF8g",\ "templates" : { },\ "indices" : { } }, "routing_table" : {\ "indices" : { } }, "routing_nodes" : {\ "unassigned" : [ ],\ "nodes" : {\ "x3WfO4aFSN6da6O7A18ljQ" : [ ],\ "6wQnJ1DfQL2T8ePNrXIUsQ" : [ ],\ "sBGUifwKTCOK6DtFRAP2bA" : [ ]\ } }}
If you see output that is similar to this, your Elasticsearch cluster is running.
In this step, you’ll install Docker.
Add Docker’s official GPG key:
1curl -fsSL https://download.docker.com/linux/ubuntu/gpg | sudo apt-key add -
Use the following command to set up the stable repository.
1sudo add-apt-repository "deb [arch=amd64] https://download.docker.com/linux/ubuntu $(lsb_release -cs) stable"
Update the apt package index:
1sudo apt-get update
Make sure you are about to install from the Docker repo instead of the default Ubuntu 16.04 repo:
1apt-cache policy docker-ce
Install the latest version of Docker CE:
1sudo apt-get install docker-ce
Docker should now be installed, the daemon started, and the process enabled to start on boot. Check that it is running:
1sudo systemctl status docker
Type q to return to the prompt.
Make sure you are in the Docker usergroup, replace tammy with your username:
1sudo usermod -aG docker tammy
Next we will create an Elasticsearch container.
After you have created your Gremlin account (sign up here) you will need to find your Gremlin Daemon credentials. Login to the Gremlin App using your Company name and sign-on credentials. These were emailed to you when you signed up to start using Gremlin.
Navigate to Team Settings and click on your Team.
Store your Gremlin agent credentials as environment variables, for example:
1export GREMLIN_TEAM_ID=3f242793-018a-5ad5-9211-fb958f8dc084
1export GREMLIN_TEAM_SECRET=eac3a31b-4a6f-6778-1bdb813a6fdc
Next run the Gremlin Daemon in a Container.
Use docker run to pull the official Gremlin Docker image and run the Gremlin daemon:
1sudo docker run -d \2 --net=host \3 --pid=host \4 --cap-add=NET_ADMIN \5 --cap-add=SYS_BOOT \6 --cap-add=SYS_TIME \7 --cap-add=KILL \8 -e GREMLIN_TEAM_ID="${GREMLIN_TEAM_ID}" \9 -e GREMLIN_TEAM_CERTIFICATE_OR_FILE="${GREMLIN_TEAM_CERTIFICATE_OR_FILE}" \10 -e GREMLIN_TEAM_PRIVATE_KEY_OR_FILE="${GREMLIN_TEAM_PRIVATE_KEY_OR_FILE}" \11 -v /var/run/docker.sock:/var/run/docker.sock \12 -v /var/log/gremlin:/var/log/gremlin \13 -v /var/lib/gremlin:/var/lib/gremlin \14 -v /proc/sysrq-trigger:/sysrq \15 gremlin/gremlin daemon
Use docker ps to see all running Docker containers:
1sudo docker ps
1CONTAINER ID IMAGE COMMAND CREATED STATUS PORTS NAMES2b281e749ac33 gremlin/gremlin "/entrypoint.sh daem…" 5 seconds ago Up 4 seconds relaxed_heisenberg
Jump into your Gremlin container with an interactive shell (replace b281e749ac33 with the real ID of your Gremlin container):
1sudo docker exec -it b281e749ac33 /bin/bash
From within the container, check out the available attack types:
1gremlin help attack-container
1attack-container: CONTAINER and TYPE must be specified23Usage: gremlin attack-container CONTAINER TYPE [type-specific-options]45Type "gremlin help attack-container TYPE" for more details:67 blackhole # An attack which drops all matching network traffic8 cpu # An attack which consumes CPU resources9 io # An attack which consumes IO resources10 latency # An attack which adds latency to all matching network traffic11 memory # An attack which consumes memory12 packet_loss # An attack which introduces packet loss to all matching network traffic13 shutdown # An attack which forces the target to shutdown14 dns # An attack which blocks access to DNS servers15 time_travel # An attack which changes the system time.16 disk # An attack which consumes disk resources17 process_killer # An attack which kills the specified process
To install Datadog in a Docker container you can use the Datadog Docker easy one-step install.
Run the following command, replacing the item in red with your own API key:
1docker run -d --name dd-agent -v /var/run/docker.sock:/var/run/docker.sock:ro -v /proc/:/host/proc/:ro -v /sys/fs/cgroup/:/host/sys/fs/cgroup:ro -e DD_API_KEY=7cfe87ac24e0ce166be9c96aea1f3f88 datadog/agent:latest
It will take a few minutes for Datadog to spin up the Datadog container, collect metrics on your existing containers and display them in the Datadog App.
View your Docker Containers in Datadog, you should see the following on the host Dashboard:
We will use the Gremlin CLI attack command to create a shutdown attack.
Now use the Gremlin CLI (gremlin) to run a shutdown attack against the host from a Gremlin container:
1docker run -i \2 --net=host \3 --pid=host \4 --cap-add=NET_ADMIN \5 --cap-add=SYS_BOOT \6 --cap-add=SYS_TIME \7 --cap-add=KILL \8 -e GREMLIN_TEAM_ID="${GREMLIN_TEAM_ID}" \9 -e GREMLIN_TEAM_CERTIFICATE_OR_FILE="${GREMLIN_TEAM_CERTIFICATE_OR_FILE}" \10 -e GREMLIN_TEAM_PRIVATE_KEY_OR_FILE="${GREMLIN_TEAM_PRIVATE_KEY_OR_FILE}" \11 -v /var/run/docker.sock:/var/run/docker.sock \12 -v /var/log/gremlin:/var/log/gremlin \13 -v /var/lib/gremlin:/var/lib/gremlin \14 -v /proc/sysrq-trigger:/sysrq \15 gremlin/gremlin attack shutdown
This attack will shutdown the Elasticsearch host where you ran the attack.
This triggers an issue referred to as Elasticsearch Split Brain which is documented below:
To check which Elasticsearch node is currently the master node in your cluster run the following:
1curl -X GET "localhost:9200/_cat/master?v
You should see something similar to the following:
1id host ip nodeEpkU82qVQ0CoIOHzZjaqBg 10.0.0.1 10.0.0.1 elasticsearch-01
View the contents of the Elasticsearch Production Log on one of your running Elasticsearch hosts:
1less /var/log/elasticsearch/production.log
You may notice issues such as other nodes in the cluster stopping the Elasticsearch service when you run the Gremlin Shutdown attack, for example:
1[2018-11-02 00:20:47,046][INFO ][cluster.service ] l[elasticsearch-02] added {{elasticsearch-03}{pPgjIxYETOWMXWwZe3hnSQ}{10.0.0.3}{10.0.0.3:9300},}, reason: zen-disco-receive(from master [{elasticsearch-01}{EpkU82qVQ0CoIOHzZjaqBg}{10.0.0.1}{10.0.0.1:9300}])
1[2018-11-02 00:21:35,041][INFO ][node ] [elasticsearch-01] stopping …
1[2018-11-02 00:21:35,048][INFO ][discovery.zen ] [elasticsearch-02] master_left [{elasticsearch-01}{EpkU82qVQ0CoIOHzZjaqBg}{10.0.0.1}{10.0.0.1:9300}], reason [shut_down]
1[2018-11-02 00:21:35,050][WARN ][discovery.zen ] [elasticsearch-02] master left (reason = shut_down), current nodes: {{elasticsearch-02}{YvAyPlK4Q9SOZCtvk-aP6Q}{10.0.0.2}{10.0.0.2:9300},{elasticsearch-03}{pPgjIxYETOWMXWwZe3hnSQ}{10.0.0.3}{10.0.0.3:9300},}
1[2018-11-02 00:21:35,052][INFO ][cluster.service ] [elasticsearch-02] removed {{elasticsearch-01}{EpkU82qVQ0CoIOHzZjaqBg}{10.0.0.1}{10.0.0.1:9300},}, reason: zen-disco-master_failed ({elasticsearch-01}{EpkU82qVQ0CoIOHzZjaqBg}{10.0.0.1}{10.0.0.1:9300})
1[2018-11-02 00:21:36,557][WARN ][transport.netty ] [elasticsearch-02] exception caught on transport layer [[id: 0xfe487d7b]], closing connection
1java.net.SocketException: Network is unreachable
To prevent Elasticsearch Split Brain from occuring we will need to take additional steps described in Step 8.
There are two common types of Elasticsearch nodes: master and data. Master nodes perform cluster-wide actions, such as managing indices and determining which data nodes should store particular data shards. Data nodes hold shards of your indexed documents, and handle CRUD, search, and aggregation operations. As a general rule, data nodes consume a significant amount of CPU, memory, and I/O.
By default, every Elasticsearch node is configured to be a "master-eligible" data node, which means they store data (and perform resource-intensive operations) and have the potential to be elected as a master node. An Elasticsearch cluster should be configured with dedicated master nodes so that the master node's stability can't be compromised by intensive data node work.
Ensure you have a cluster with 3 Elasticsearch nodes
First, restart the Elasticsearch master node that you shutdown in the previous step.
You will need 3 master nodes to run this Chaos Engineering experiment.
How to Configure Dedicated Master Nodes
Before configuring dedicated master nodes, ensure that your cluster will have at least 3 master-eligible nodes. This is important to avoid a split-brain situation, which can cause inconsistencies in your data in the event of a network failure.
To configure a dedicated master node, edit the node's Elasticsearch configuration:
1sudo vi /etc/elasticsearch/elasticsearch.yml
Add the following lines:
1# Set the node's role node.master: true node.data: false
The first line, node.master: true, specifies that the node is master-eligible and is actually the default setting. The second line, node.data: false, restricts the node from becoming a data node.
Save and exit.
Now restart the Elasticsearch node to put the change into effect:
1sudo service elasticsearch restart
Be sure to repeat this step on your other dedicated master nodes.
You can query the cluster to see which nodes are configured as dedicated master nodes with this command:
1curl -XGET 'http://localhost:9200/_cluster/state?pretty'.
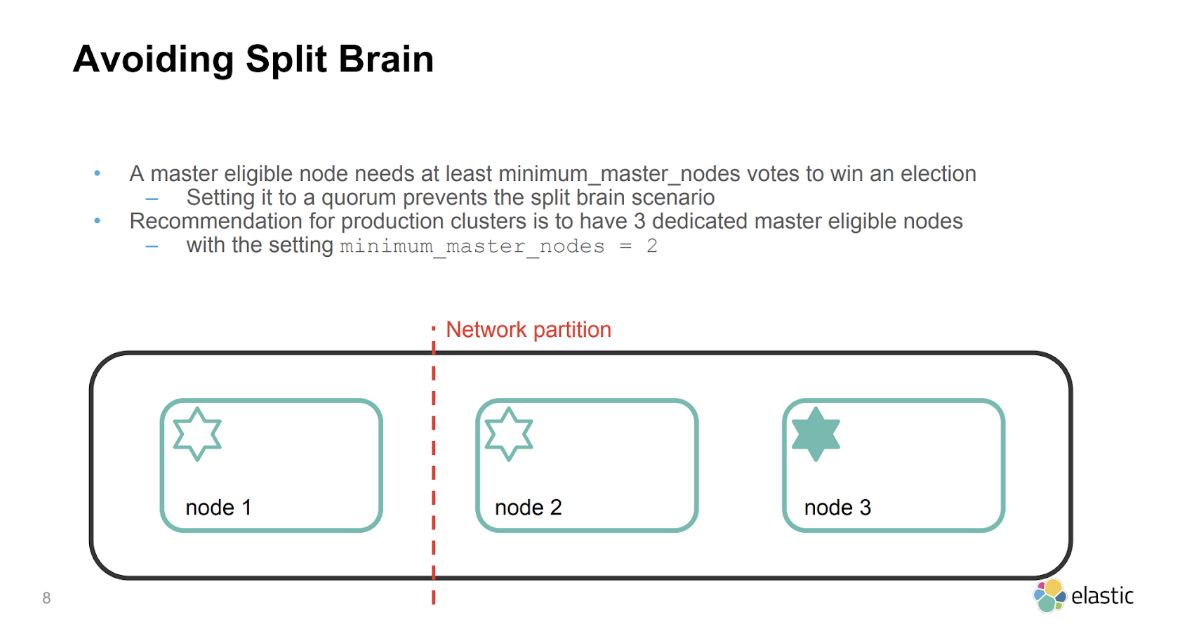
Configure Minimum Master Nodes
When running an Elasticsearch cluster, it is important to set the minimum number of master-eligible nodes that need to be running for the cluster to function normally, which is often referred to as quorum. This is to ensure data consistency in the event that one or more nodes lose connectivity to the rest of the cluster, preventing what is known as a "split-brain" situation. For example, for a 3-node cluster, the quorum is 2.
The minimum master nodes setting can be set dynamically, through the Elasticsearch HTTP API. Run this command on any node:
1curl -XPUT localhost:9200/_cluster/settings?pretty -d '{"persistent" : {"discovery.zen.minimum_master_nodes" : 2}}'You should see the following result: { "acknowledged" : true, "persistent" : {\ "discovery" : {\ "zen" : {\ "minimum_master_nodes" : "2"\ }\ } }, "transient" : { }}
This setting can also be set as in /etc/elasticsearch.yml as:
1discovery.zen.minimum_master_nodes: 2
If you want to check this setting later, you can run this command:
1curl -XGET localhost:9200/_cluster/settings?pretty
Running the Elasticsearch Split Brain Chaos Engineering Experiment After Config Changes
We will use the Gremlin CLI attack command to create a CPU attack.
Now use the Gremlin CLI (gremlin) to run a CPU attack from within a Gremlin container:
1sudo docker run -i \2 --net=host \3 --pid=host \4 --cap-add=NET_ADMIN \5 --cap-add=SYS_BOOT \6 --cap-add=SYS_TIME \7 --cap-add=KILL \8 -e GREMLIN_TEAM_ID="${GREMLIN_TEAM_ID}" \9 -e GREMLIN_TEAM_CERTIFICATE_OR_FILE="${GREMLIN_TEAM_CERTIFICATE_OR_FILE}" \10 -e GREMLIN_TEAM_PRIVATE_KEY_OR_FILE="${GREMLIN_TEAM_PRIVATE_KEY_OR_FILE}" \11 -v /var/run/docker.sock:/var/run/docker.sock \12 -v /var/log/gremlin:/var/log/gremlin \13 -v /var/lib/gremlin:/var/lib/gremlin \14 -v /proc/sysrq-trigger:/sysrq \15 gremlin/gremlin attack shutdown
This attack will shutdown the Elasticsearch host.
To check which Elasticsearch host is currently the master node in your cluster run the following on any host:
1curl -X GET "localhost:9200/_cat/master?v
You should see something similar to the following:
1id host ip nodeMHOVfw_VSL2apsJ_LKiNrg 10.0.0.3 10.0.0.3 elasticsearch-03
Now that you have resolved the Split Brain issue, when you shutdown a master you will find a message similar to the following in /var/log/elasticsearch/production.log:
1[elasticsearch-02] not enough master nodes, current nodes: {{elasticsearch-02}{RE_2u5HQR3mMLzSFQuT4oQ}{10.0.0.2}{10.0.0.2:9300}{data=false, master=true},}
There are many Chaos Engineering experiments you could possibly run on your Elasticsearch infrastructure:
We encourage you to run these Chaos Engineering experiments and share your findings! To get access to Gremlin, sign up here.
This tutorial has explored how to install Elasticsearch and Gremlin in Docker containers for your Chaos Engineering experiments. We then ran a shutdown Chaos Engineering experiment on the Elasticsearch container using the Gremlin Shutdown attack.
Gremlin empowers you to proactively root out failure before it causes downtime. See how you can harness chaos to build resilient systems by requesting a demo of Gremlin.
Get started