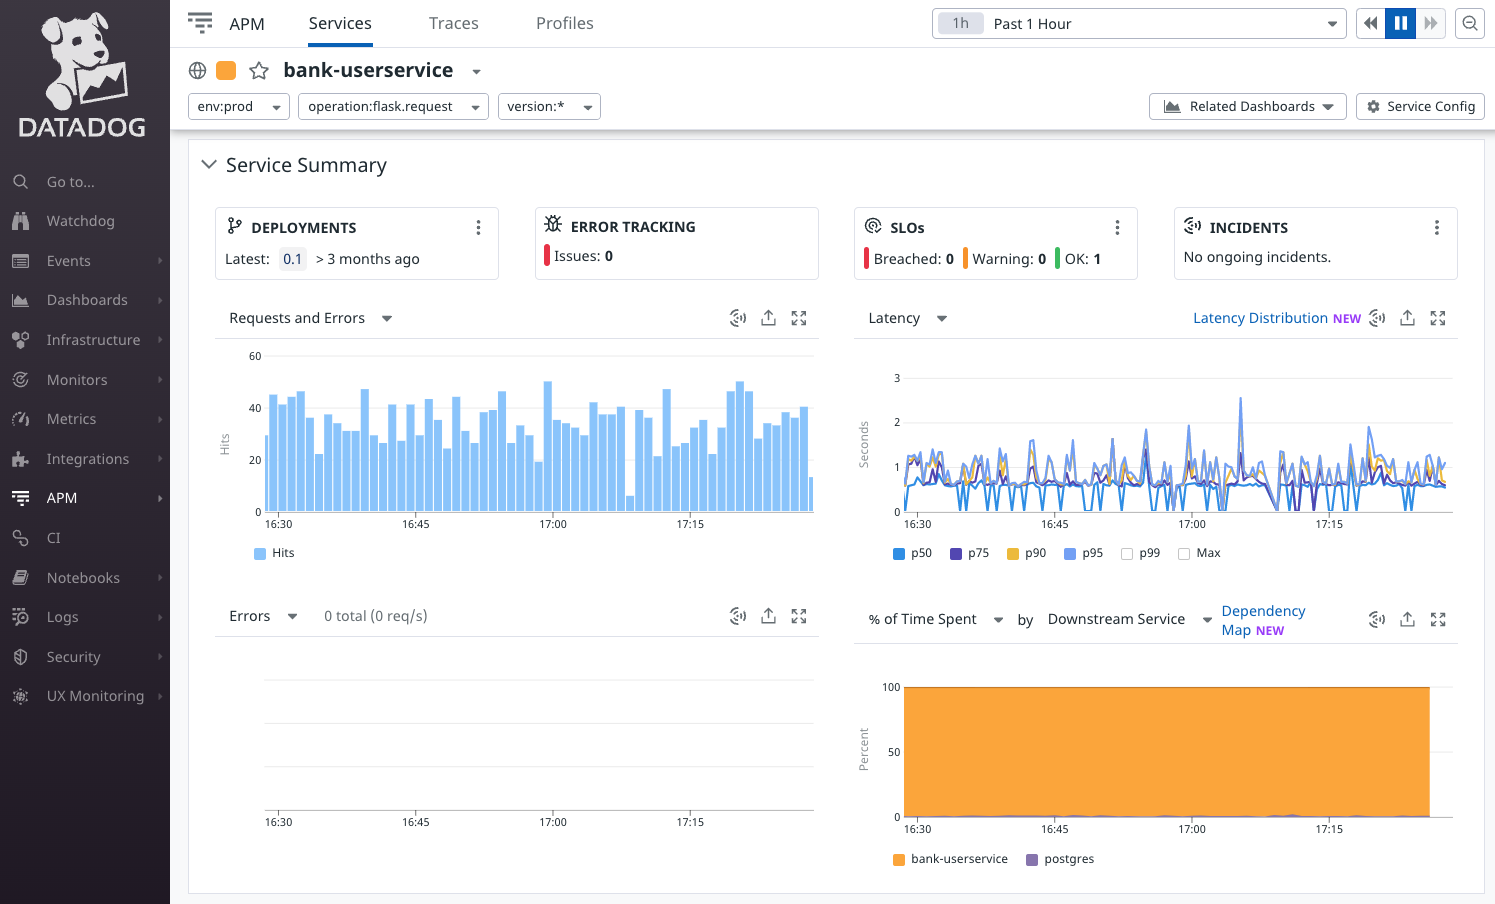
To many engineers, the idea that you can accurately and comprehensively track your application's user experience using just a few simple metrics might sound far-fetched. Believe it or not, there are four metrics that aim to do just that. They're called the four Golden Signals and should be a core part of your observability and reliability practices.
Let's start with the obvious question: what are the four Golden Signals? The Golden Signals—latency, traffic, error rate, and resource saturation—are a service's four most important attributes from the perspective of end users. They originated from the Google Site Reliability Engineering Handbook and have since been adopted into many teams' monitoring and alerting practices. These four metrics can tell us:
- How well is our service performing?
- How close is our service to its maximum capacity?
- What errors (if any) is our service generating?
- How many more users can the service handle before problems arise?
How do Golden Signals relate to SLOs, SLAs, and SLIs?
SLAs, or Service Level Agreements, are contracts between service providers and customers that promise a minimum quality of service. They typically describe service quality in terms of uptime/availability, response time, error rate, performance, and other measurements.
At the foundation of SLAs are Service Level Indicators (SLIs), the specific metrics that teams monitor to track their adherence to an SLA. An SLA comprises one or more Service Level Objectives (SLOs), which are the ranges that SLIs must fall within to satisfy the SLA requirements. In other words, we're meeting our SLA as long as our SLIs fall within our SLOs.
Golden Signals influence SLOs (and, by extension, SLAs) via SLIs. Remember, Golden Signals represent a service's most important attributes from your users' perspective. In other words, they're foundational to the user experience, which is why it's best to link them to the foundation of your SLOs.
Connect your Golden Signals to your SLIs
First, think about each of the Golden Signals, what it represents, and how it maps to your existing SLIs. In the best cases, there's a one-to-one relationship: for example, if one of your SLIs tracks the response time of HTTP requests to and from a service, then you're already tracking latency. In other cases, you may need to create a new SLI corresponding to a Golden Signal.
Next, think about how these new SLIs fit into your SLOs. These can also be straightforward one-to-one mappings (for example, latency must fall under 2,000 milliseconds), or you might have composite SLOs, which are made up of multiple SLIs (for example, latency must fall under 2,000 ms, and the error rate must be below 10%). Determining the exact parameters of your SLOs should be a joint effort between business and technical leaders for several reasons:
- SLA violations can have financial or legal impacts on the business.
- Engineers best understand how to translate business requirements to technical requirements.
Once you've identified how the Golden Signals map to your SLIs, you can adjust your SLOs to better reflect the real-world state of your services and give you plenty of advanced warning in case your services are close to exceeding their SLOs.
Consider that Golden Signals might highlight a behavior in your service that your previous metrics didn't. Let's take error rate, for example. Previously, you might have only tracked errors by looking for responses containing an HTTP 500 error code. These parameters will ignore errors where the HTTP status code indicates success, but the service's backend logic couldn't process the request. Tracking these errors, in addition to HTTP 500 errors, might significantly increase your error rate metric and make your service seem less reliable than it is. The number of errors hasn't changed, but now you have a much more accurate view of your end-user experience.
Track and monitor your SLOs using your observability tool
After identifying your SLIs and SLOs, create monitors in your observability tool to track them. Configure alerts to fire if it appears any of your SLIs are about to exceed their SLOs, so you have enough advance notice to respond to the problem. Enterprise observability tools like Datadog and New Relic can trigger alerts based on gradual trends and sudden changes, giving you the time necessary to avoid a large-scale outage.

Use proactive testing to ensure you can continually meet your SLOs
Alerts can notify you when something happens to your services, but this is a reactive measure. If you want to ensure you can meet your SLOs before an incident occurs, you'll need to adopt a practice called Reliability Management. Reliability Management helps teams automate and standardize reliability, which includes testing services and objectively measuring their reliability.
Gremlin, the industry's first Reliability Management solution, lets you run reliability tests safely, simply, and securely. It continually monitors your Golden Signals throughout a test to verify that your service is healthy (i.e., within your SLOs); if not, it instantly halts the test. This way, you have clear guidance on which of your SLOs are at risk.
If you want to learn more about using Golden Signals to meet your SLOs and SLAs better, check out our free white paper: Achieving SLO Success with Golden Signals and Reliability Testing.


