
In our last blog, we talked about the importance of setting memory requests when deploying applications to Kubernetes. We explained how memory requests lets you specify how much memory (RAM for short) Kubernetes should reserve for a pod before deploying it. However, this only helps your pod get deployed. What happens when your pod is running and gradually consumes more RAM over time?
This blog continues on our previous blog by explaining memory limits and why they're equally important for running resilient applications. We'll also show you how Gremlin detects and notifies you of missing memory request definitions in your Kubernetes deployments.
What are memory limits and why are they important?
A memory limit is a cap on how much RAM a pod is allowed to consume over its lifetime. When you deploy a pod without memory limits, it can consume as much RAM as it wants like any other process. If it continually uses more and more RAM without freeing any (known as a memory leak), eventually the host it's running on will run out of RAM. At that point, a kernel process called the OOM (out of memory) killer jumps in and terminates the process before the entire system becomes unstable.
While the OOMKiller should be able to find and stop the appropriate pod, it's not always guaranteed to be successful. If it doesn't free enough memory, the entire system could lock up, or it could kill unrelated processes to try and free up enough memory. It's much less predictable than simply declaring that a pod shouldn't be allowed to use more than X GB of RAM.
Setting a limit and a request creates a range of memory that the pod could consume, making it easier for both you and Kubernetes to determine how much memory the pod will use on deployment.
How are memory limits different from requests?
Memory requests are a similar concept that also affect how memory is allocated (or not allocated) to individual pods. There's a key difference: requests specify how much memory to allocate to pods on creation, while limits specify the maximum amount of memory a pod can use before it's terminated. Essentially, the request is the minimum amount of memory allocated to a pod, and the limit is the max.
What should I set the memory limit to?
Setting a memory limit is trickier than setting a memory request for two reasons:
- If it's too low, the pod might terminate shortly after starting, or even continuously restart and enter a
CrashLoopBackOffstate. - If it's too high, then the pod could consume a disproportionate amount of memory relative to others.
To do this right, we'll need to measure the range of memory our pod uses during normal operation and set our memory limit to accomodate it without being too excessive. The most direct method is to use the Kubernetes Metrics API, Kubernetes Dashboard, or an observability tool to track memory usage over time. There are also tools like Goldilocks that automate this.
For example, let's use kubectl top pod to get a list of pods with their CPU and memory usage:
1NAMESPACE NAME CPU(cores) MEMORY(bytes)2bank-of-anthos accounts-db-0 5m 55Mi3bank-of-anthos balancereader-c6bff755b-x7tzn 9m 211Mi4bank-of-anthos contacts-6df47656c8-dchxf 17m 84Mi5bank-of-anthos frontend-6f7b5f7f88-v6vdw 94m 67Mi6ingress-nginx ingress-nginx-controller-77945d74f8-nw7n9 3m 24Mi
Looking at the balancereader-c6bff755b-x7tzn pod, we see it's using 211Mi of memory. If we assume this is the average amount of memory the pod will use during its lifetime, we can set a memory limit of 250Mi to ensure the pod never exceeds that amount. If it does, Kubernetes will evict the pod and spin up a new one, preventing any one instance from consuming a disproportionate amount of RAM:
1...2spec:3 containers:4 - name: balancereader5 image: balancereader:latest6 resources:7 limit:8 memory: "250Mi"9...
Limits use the same syntax as requests. Once you have your amounts defined, deploy the manifest using kubectl and Kubernetes will re-deploy the pod with the new limit.
How do I validate that my memory limits are in place?
First and foremost, run kubectl get pod after deploying your memory limits to make sure the limits are part of your pod definition. This is how Gremlin's Detected Risks feature works to detect missing memory limits.
You can also use Gremlin to run a Chaos Engineering experiment to test this directly. Building on the balancereader example, we can use Gremlin to consume exactly 250Mi of memory or higher in our balancereader pod, then observe to see whether Kubernetes evicts it as it should. This will also tell us how long it takes Kubernetes to reschedule a new instance of the pod, and whether there are interruptions to service.
To test this using the Bank of Anthos example:
- Log into the Gremlin web app at app.gremlin.com.
- Select Experiments in the left-hand menu and select New Experiment.
- Select Kubernetes, then select the
balancereaderPod. - Expand Choose a Gremlin, select the Resource category, then select the Memory experiment.
- For the Allocation Strategy, select "Bring system to amount" from the drop-down. This adjusts the amount of memory consumed to bring it to a certain amount - in this case, 250 Mi.
- Change the Memory Amount from GB to MB and increase the amount to 265. We need to use a slightly higher value here due to the conversion from MB (megabytes) to MiB (mebibytes).
- Click Run Experiment to start the experiment.
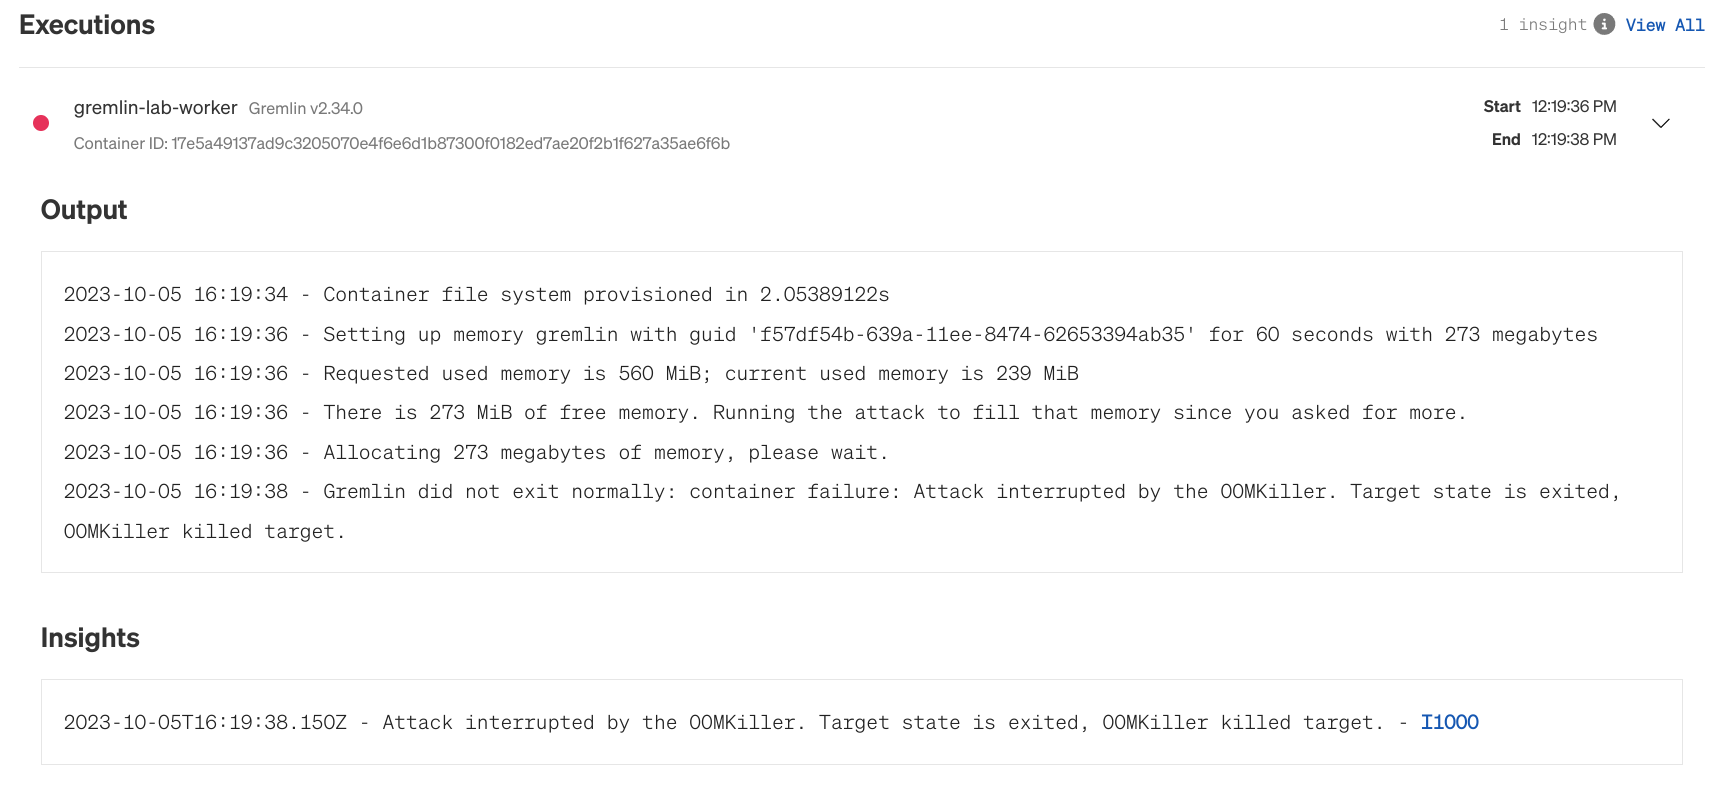
Now, one of two things can happen: Kubernetes may evict and restart the balancereader pod, or it may evict the Gremlin client pod. The Gremlin pod can be evicted due to how Gremlin runs experiments on Kubernetes. It creates a sidecar container running in the same pod as the experiment's target: in this case, the balancereader pod. This Gremlin container is what's responsible for allocating memory in the pod. Kubernetes may detect this, and instead of restarting the whole pod, simply terminate the Gremlin container process within the pod. This may result in the web app showing the status of the experiment as "Client Aborted." This might seem like a failed test at first, but really it proves our hypothesis: Kubernetes will immediately detect and respond to pods that try to consume resources past their limits.
What other Kubernetes risks should I be looking for?
We've covered memory requests, CPU requests, liveness probes, and high availability in our ongoing blog series on Detected Risks. Read those to learn more about the different kinds of Kubernetes risks that Gremlin automatically detects, how you can test for them, and how to resolve them.
We'll continue posting blog posts as we release new Detected Risks, so stay tuned! In the meantime, you can get a free report of your reliability risks in minutes by signing up for a free 30-day trial.

